Brett,
Grandma says: You need to look at the previous completed candle on the Daily Chart ...no more ...no less. The rest as our padwan friend said.. read and your answers will be there.
Hope this helps
Grandma says: You need to look at the previous completed candle on the Daily Chart ...no more ...no less. The rest as our padwan friend said.. read and your answers will be there.
Hope this helps
Quoting brett1234DislikedHi all, newbie here. I have not read every thread but I did read the beginning and I do not see anyone clearly answering the question that is lingering in my little head. The instructions for this trade say:
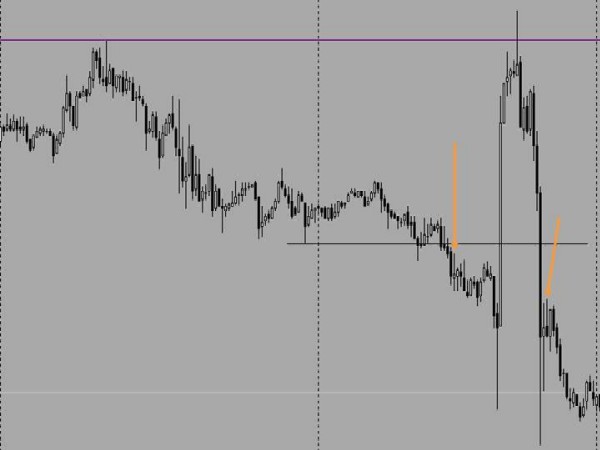
<DIR><DIR>Draw support and resistance on any of the previous bar. For newbies and JaJa Binks, Support is the lowest price of the candle and Resistance is the highest price of the candle. Draw horizontal lines.
Do you see the next candle penetrating the lines?
</DIR></DIR>a. YES: That’s your trade
Forgive the dumb q but what is my trade? In other words, how many daily candles are we looking at? I know what support and resistance is, but what is being referred to in this trade? Usually S and R are based on weeks or even months of charts but I do not see where you enter a trade based on one day of a candle going above (for going long) ....what? Above the previous day or the previous obvious resistance level? For resistance levels on a daily chart, I would think that the number could vary by quite a few pips since no resistance number is exact if you are basing it on the resistance level of say, a few weeks ago. I hope there is a simple answer. Maybe someone could provide a screen shot with example trade? Thanks!
BrettIgnored
All 4 1 and 1 4 All