I would like to get your opinion on Price methods. Alot of traders define price in different manners, some used multitimeframes etc etc.
I have presented 2 charts to help our cause for discussion.
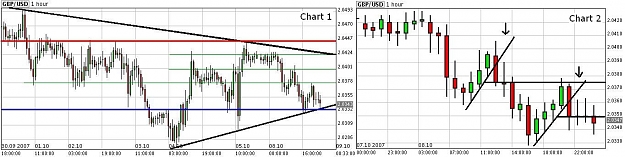
Chart 1 is the current 1hr trend og GU....
I have identified certain patterns within this chart form...
1. Reverse head and shoulders?
2. Triangular consolidation
3. Rectangle Range
What would be your cause of action?
Looking at the long term trend, you should go short...but then again the short term trend is already showing you signs of reversal, dilemma...
What are the strategies that i could put into use in order to gain from the current PA?
Seriously, i would love to go short BUT BUT BUT.......
looking at chart1...price is already at support level, it would not be wise, coz price might just rebound, infact it would be a better idea to go long and target the top of the rectangle as my TP then going short, Oh also note that we might reach the top of the Downtrendline at 2.0400, so note to go short there, blah blah blah......Confused already? lol
Look at chart 2 now....is it easier to trade with less data and less biases? I really think so! Well theres nothing wrong in noting SR areas but over analysis...can really hurt a traders cause for riches...
Lets discuss how you guys would intepret the charts below.
I have presented 2 charts to help our cause for discussion.
Chart 1 is the current 1hr trend og GU....
I have identified certain patterns within this chart form...
1. Reverse head and shoulders?
2. Triangular consolidation
3. Rectangle Range
What would be your cause of action?
Looking at the long term trend, you should go short...but then again the short term trend is already showing you signs of reversal, dilemma...
What are the strategies that i could put into use in order to gain from the current PA?
Seriously, i would love to go short BUT BUT BUT.......
looking at chart1...price is already at support level, it would not be wise, coz price might just rebound, infact it would be a better idea to go long and target the top of the rectangle as my TP then going short, Oh also note that we might reach the top of the Downtrendline at 2.0400, so note to go short there, blah blah blah......Confused already? lol
Look at chart 2 now....is it easier to trade with less data and less biases? I really think so! Well theres nothing wrong in noting SR areas but over analysis...can really hurt a traders cause for riches...
Lets discuss how you guys would intepret the charts below.
Attached Image (click to enlarge)