• Home
  • Forums
  • Trades
  • News
  • Calendar
  • Market
  • Brokers
  • Login
  • Join
  • User/Email: Password:
  • 11:20pm
Menu
  • Forums
  • Trades
  • News
  • Calendar
  • Market
  • Brokers
  • Login
  • Join
  • 11:20pm
Sister Sites
  • Metals Mine
  • Energy EXCH
  • Crypto Craft

Options

Bookmark Thread

First Page First Unread Last Page Last Post

Printable Version

Similar Threads

Killer B 71 replies

ECN && STP && Scalping && Hedging - Broker Review - Oct 2009 24 replies

TEB One Min killer 82 replies

Killer Charting Software. (I'm searching for replacement to eSignal) 10 replies

Killer B System Q & A 0 replies

  • Trading Systems
  • /
  • Reply to Thread
  • Subscribe
  • 8
Attachments: Killer 'B' System Q & A
Exit Attachments

Killer 'B' System Q & A

  • Last Post
  •  
  • 1 Page 2
  • 1 Page 2
  •  
  • Post #21
  • Quote
  • Aug 29, 2007 7:45pm Aug 29, 2007 7:45pm
  •  Bemac
  • Joined Jan 2006 | Status: Monarch o' the Glen | 5,561 Posts
Quoting Deadly Avenger
Disliked
Coming back to the topic in hand,
do you mean the highest and lowest daily range observed previously? This is what I think you mean.
Ignored
Correct

Quoting Deadly Avenger
Disliked
If this is correct, how far back do we look for the extremes of the range, a year?
Ignored

As far as your platform will allow although shorter periods do tend to respond better to Current Markets.

Quoting Deadly Avenger
Disliked
Would it be better to plot a normal distribution of the daily range and use the top and bottom 15% of the distribution as the high and low to remove even the effect of outliers from the MDR calculation?
Ignored

Something to think about. May require some research.


Still in Old Country but the deed is done.
Will be back this weekend. {Travel day tomorrow & Friday}
  • Post #22
  • Quote
  • Sep 4, 2007 7:43am Sep 4, 2007 7:43am
  •  thehedge
  • | Joined Jul 2007 | Status: Member | 26 Posts
Hi Bemac,

So sorry for your loss.

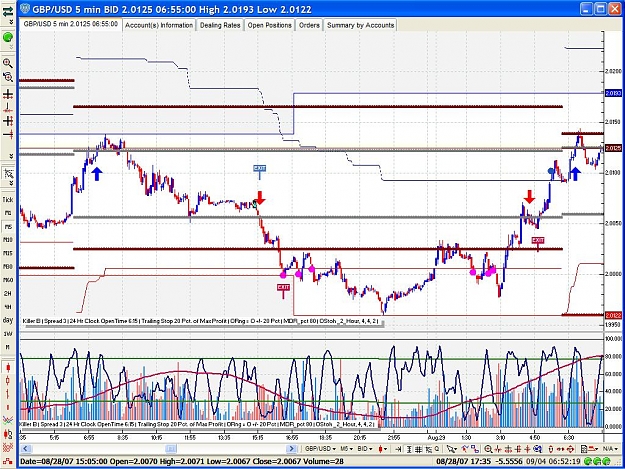
I've been following your thread with much interest but am trying hard to understand your system at the same time. Here's the Killer B at work on VTTrader and hope you'll be able to clarify the rules of your system.

1. I assume the 2 lines straddling the 06:15 opening price is the entry price (20%MDR). What about the 2 darker lines beyond that? What are they for?

2. And are the 2 thinner lines even beyond the darker lines (which tend to follow price as it makes new highs and lows) the exit price (80%MDR)?

3. I believe the stop-and-reverse point is the exit sign followed by the red arrow. However, shouldn't that have taken place at the 12:00 mark when price actually broke below the lower bound?

4. Do you re-enter during the same day even if TP has been hit (characterised by the second red arrow towards the EOD or is that signal to be ignored)?

5. How do you make use of the stochs and volume indicator to filter your entries? You mentioned that you will only enter if both stochs are within 10 of each other. In this case, since both are not, do you not take the trade?

Hope to understand your system better!
Attached Image (click to enlarge)
Click to Enlarge

Name: killer b.JPG
Size: 186 KB
  • Post #23
  • Quote
  • Sep 4, 2007 9:31am Sep 4, 2007 9:31am
  •  Bemac
  • Joined Jan 2006 | Status: Monarch o' the Glen | 5,561 Posts
Quoting thehedge
Disliked
Hi Bemac,

Thank You.

I've been following your thread with much interest but am trying hard to understand your system at the same time. Here's the Killer B at work on VTTrader and hope you'll be able to clarify the rules of your system.

1. I assume the 2 lines straddling the 06:15 opening price is the entry price (20%MDR). What about the 2 darker lines beyond that? What are they for?
If you kept the original colour coding, the two Grey Lines are 20% Entry Lines. The two Drk Magenta Lines are Previous 24 Hr High & Low.

2. And are the 2 thinner lines even beyond the darker lines (which tend to follow price as it makes new highs and lows) the exit price (80%MDR)?
Correct. The two thinner dashed lines are the 80% Targets.

3. I believe the stop-and-reverse point is the exit sign followed by the red arrow. However, shouldn't that have taken place at the 12:00 mark when price actually broke below the lower bound?
The System is based on the Close of The Bar. Crossing & Retrating before the Bar Closes Negates the Signal.

4. Do you re-enter during the same day even if TP has been hit (characterised by the second red arrow towards the EOD or is that signal to be ignored)?
I Do Re-Enter. Notice, however, that the exit for that Short Entry @ ~ 4:30 AM on Aug 29 was Exited @ ~ 5:00 AM as this was within 1Hr of the Start Hour of a New Session ie, 6:?? AM.
This is one area I have already identified as requiring some additional thought as exampled by the Current Short on the 5Min GBPUSD.
If a New Signal is generated AFTER that End of Session Timed Exit, It will hold the Position Open into the Start of the New Session. This Particular Trade was a nice Entry but it is not actually a true part of the System.
Notice that this Trade appears to have a Premature Exit. This is due to the Trailing Stop {Yellow Line} Calculating 50% of the distance between Entry & Short Target of Previous Session.


5. How do you make use of the stochs and volume indicator to filter your entries? You mentioned that you will only enter if both stochs are within 10 of each other. In this case, since both are not, do you not take the trade?
The Code Requires that ABS(OStoh-StdStoh) <=10.
This means the System should not have generated a Signal.
Can you point me to which Signal you are referring to?

I use the Volume Indicator merely as a visual


Hope to understand your system better!
Ignored
Does any of that help?
  • Post #24
  • Quote
  • Sep 4, 2007 12:26pm Sep 4, 2007 12:26pm
  •  thehedge
  • | Joined Jul 2007 | Status: Member | 26 Posts
Quoting Bemac
Disliked
Does any of that help?
Ignored
It sure has, thanks! Hope you won't mind me making further clarifications?

1. The dark magenta lines seem to be only visual guides since they are previous highs and lows. Any other uses for them?

2. Before running your system on VTTrader, I thought the 80% targets were fixed stops. But it now shows that they move as price moves. Is this always the case?

3. Thanks for your clarifications on the signal at the close of the bar and your rules for re-entry. Unfortunately, I do not see the trailing stop (yellow line) on the chart. Would you mind pointing it out and explaining how it works?

4. The signal I was referring to is the first blue arrow circled in red. The corresponding stoch levels (also circled in red) are blue line ~ 50 and red line ~ 30 (difference > 10). Am I reading it correctly? Do you happen to know whether MT4 has a function to overlay stochs of different TFs on one another?

5. How do you use volume as a visual aid? E.g. when volume is very thin you do not enter a trade?

Thanks alot for your help.


Attached Image (click to enlarge)
Click to Enlarge

Name: killer b.JPG
Size: 182 KB
  • Post #25
  • Quote
  • Sep 4, 2007 8:07pm Sep 4, 2007 8:07pm
  •  Bemac
  • Joined Jan 2006 | Status: Monarch o' the Glen | 5,561 Posts
Is there any way you can change the Title of this thread to read "Killer B System Q & A"

I know you can Thanks Scott
  • Post #26
  • Quote
  • Sep 4, 2007 10:44pm Sep 4, 2007 10:44pm
  •  JR97
  • Joined Apr 2004 | Status: #slack pricetimeforecast | 1,909 Posts | Online Now
Quoting Deadly Avenger
Disliked
Would it be better to plot a normal distribution of the daily range and use the top and bottom 15% of the distribution as the high and low to remove even the effect of outliers from the MDR calculation?

Ignored
That is essentially Market Profile. There is a lot to learn reading up on Market Profile.
  • Post #27
  • Quote
  • Sep 5, 2007 12:01am Sep 5, 2007 12:01am
  •  Bemac
  • Joined Jan 2006 | Status: Monarch o' the Glen | 5,561 Posts
Quoting thehedge
Disliked
It sure has, thanks! Hope you won't mind me making further clarifications?

1. The dark magenta lines seem to be only visual guides since they are previous highs and lows. Any other uses for them?
Visual Guides. Correct!

2. Before running your system on VTTrader, I thought the 80% targets were fixed stops. But it now shows that they move as price moves. Is this always the case?
Yes. The Lowest low Target will be affected by the Highest High achieved. The premis being that the distance between HHV & LLV will be close to MDR.

3. Thanks for your clarifications on the signal at the close of the bar and your rules for re-entry. Unfortunately, I do not see the trailing stop (yellow line) on the chart. Would you mind pointing it out and explaining how it works?
Will attempt posted image.

4. The signal I was referring to is the first blue arrow circled in red. The corresponding stoch levels (also circled in red) are blue line ~ 50 and red line ~ 30 (difference > 10). Am I reading it correctly? Do you happen to know whether MT4 has a function to overlay stochs of different TFs on one another?
Can't confirm <10 therefore no comment AT THIS TIME.


5. How do you use volume as a visual aid? E.g. when volume is very thin you do not enter a trade?
Exactly.

Thanks alot for your help.
Ignored
Image containing TS.
Attached Image
Attached Image
File Type: bmp TS in Yellow.bmp   769 KB | 183 downloads
  • Post #28
  • Quote
  • Sep 5, 2007 11:49am Sep 5, 2007 11:49am
  •  thehedge
  • | Joined Jul 2007 | Status: Member | 26 Posts
Hi Bemac,

Thanks for your replies. I'm beginning to understand your system much better. Just a few more questions (I seem to be the only one asking though)...

Trailing Stop:

  1. When do you exit the trade at the TP (80%MDR) and when do you allow TS to kick in? The attached image "Trailing Stop" shows the exit (circled in red) stopped out by the TS. Why wasn't the trade allowed to exit at TP?
  2. You mentioned that TS kicks in when price is "50% of the distance between Entry & Short Target of Previous Session". What is the rationale of calculating it based on the previous session instread of current session?
  3. How many pips is the TS?

Stop and Reverse:

  1. I understand that if price hits the buy stop, the trade is initiated. However, if price reverses and hits the sell stop before hitting the long TP, the trade is stopped and reversed. What happens then if price reverses a second time to the long side of the trade without hitting the short TP? Do you SAR again or do you employ a fixed stop after going short?

Stochs:

  1. May I know the rationale for stochs to be <10 in order to enter a trade?
  2. Would you have taken the trade on 28 Aug 07:20? Looks like stochs were ~ 20. How about the long signal on 30 Aug 08:55 when stochs were miles apart from each other?

Others:

  1. In images "1" and "2", an exit signal appears (circled in red) without any apparent reason. Price did not hit TP, nor was there a TS, nor was it an hour before session close. What could have been the reason to exit the trade?

Hope I'm not of too much trouble to you, sir.

Attached Images (click to enlarge)
Click to Enlarge

Name: Trailing Stop.JPG
Size: 144 KB Click to Enlarge

Name: 1.JPG
Size: 158 KB Click to Enlarge

Name: 2.JPG
Size: 162 KB
  • Post #29
  • Quote
  • Sep 5, 2007 9:22pm Sep 5, 2007 9:22pm
  •  Bemac
  • Joined Jan 2006 | Status: Monarch o' the Glen | 5,561 Posts
Quoting thehedge
Disliked
Hi Bemac,

Thanks for your replies. I'm beginning to understand your system much better. Just a few more questions (I seem to be the only one asking though)...
But yet, I think {hope}, not the only one reading the replies. No worries. This is what it takes to UNDERSTAND & TRADE A SYSTEM.

All good questions btw.


Trailing Stop:

  1. When do you exit the trade at the TP (80%MDR) and when do you allow TS to kick in? The attached image "Trailing Stop" shows the exit (circled in red) stopped out by the TS. Why wasn't the trade allowed to exit at TP?
  2. You mentioned that TS kicks in when price is "50% of the distance between Entry & Short Target of Previous Session". What is the rationale of calculating it based on the previous session instread of current session?
  3. How many pips is the TS?
  4. LongEntrySetup := LongTradeAlert = 0
    AND CloseWeek = 1
    AND MyClock < 24
    AND Ref(Low,-1) < HighEnt
    AND Close > HighEnt
    AND StDK - AvgStDK >= -10
    AND AvgStDK > LHoriz;

    LongExitSetup := LongTradeAlert = 1
    AND Cross(High,HighTgt)
    OR LongTradeAlert = 1
    AND Cross(LowEnt,Close)
    OR LongTradeAlert = 1
    AND MaxTradeProfit > Trailer *TrailerMultiple
    AND Ref(Close,-3) - Close >= MaxTradeProfit*(MaxTrdPftFactor/100)
    OR LongTradeAlert = 1
    AND Cross(MyStop, Close)
    OR LongTradeAlert = 1
    AND Cross(Hour()=OpenHour-1,0.5)
    OR LongTradeAlert = 1
    AND DayOfWeek()= 5 And Cross(Hour()=13,0.5) ;
  5. Hopefully this responds to all of the above & your "Others" Q. It may not be all the answers but...

Stop and Reverse:

  1. I understand that if price hits the buy stop, the trade is initiated. However, if price reverses and hits the sell stop before hitting the long TP, the trade is stopped and reversed. What happens then if price reverses a second time to the long side of the trade without hitting the short TP? Do you SAR again or do you employ a fixed stop after going short?
  2. Only seen it happen a few times where I Have two whips but never three, so far.

Stochs:

  1. May I know the rationale for stochs to be <10 in order to enter a trade?
  2. It abbreiviates the Code & therefore time required to Run the Code rather than a lengthy definition of Both Stohs Crested AND heading South for Short Entry
  3. Would you have taken the trade on 28 Aug 07:20? Looks like stochs were ~ 20.
  4. Don't Know.
  5. How about the long signal on 30 Aug 08:55 when stochs were miles apart from each other?
  6. Sorry for my earlier incorrect definition of the {Stohs} Setup. Read the Blue Line Above in Long Entry.

Others:

  1. In images "1" and "2", an exit signal appears (circled in red) without any apparent reason. Price did not hit TP, nor was there a TS, nor was it an hour before session close. What could have been the reason to exit the trade?
  2. See Above for Exit Criteria.

Hope I'm not of too much trouble to you, sir.

Ignored
Not at all. Keep em comin'.
  • Post #30
  • Quote
  • Sep 5, 2007 9:44pm Sep 5, 2007 9:44pm
  •  Bemac
  • Joined Jan 2006 | Status: Monarch o' the Glen | 5,561 Posts
I think I may have confused you even more with the response above.
Let me first target the TS.

WHen an Entry is Triggered I know a number of things.
1) Entry Price.
2) Exit Price
3) Price at half that distance. {(Entry +/- Price Target) / 2}

Until the Price crosses 3) {50% of Target Achieved}The TS is not active.

When 3) IS ACHIEVED, the TS is Activated at a level of Max Trade Profit {so far} minus {-} 20% of Max Trade Profit so far.

So...
If my Target Pip Profit is 100p, the TS will be activated whe the position is positive 50p and will be set 20% below Max Position Profit So Far.
ie 50p - (50p*0.2)
= 50 - 10 for a lock of 40p Profit
This means if the Trade goes positve 50p, I will lock in a profit of 40p and be stopped out if it pulls back 10p from the Max Profit Price.

If the Trade continues to go my way from the 50p Profit mark, the TS will continue to move with it.
ie. The Trade goes 80p in profit, TS @ 80p-(80p*0.2)
=80 - 16 for a lock of 64p Profit.
And so on until I am either Stpped or Exited on TP.
  • Post #31
  • Quote
  • Sep 6, 2007 1:32am Sep 6, 2007 1:32am
  •  accrete
  • Joined Jan 2006 | Status: Pips Ahoy! | 1,130 Posts
my mommy taught me not to talk while eating. there is a lot here for me to digest. I'm quiet but serriously interested and following along.

: ) Thom
  • Post #32
  • Quote
  • Sep 6, 2007 1:18pm Sep 6, 2007 1:18pm
  •  thehedge
  • | Joined Jul 2007 | Status: Member | 26 Posts
Quoting Bemac
Disliked
I think I may have confused you even more with the response above.
Let me first target the TS.

WHen an Entry is Triggered I know a number of things.
1) Entry Price.
2) Exit Price
3) Price at half that distance. {(Entry +/- Price Target) / 2}

Until the Price crosses 3) {50% of Target Achieved}The TS is not active.

When 3) IS ACHIEVED, the TS is Activated at a level of Max Trade Profit {so far} minus {-} 20% of Max Trade Profit so far.

So...
If my Target Pip Profit is 100p, the TS will be activated whe the position is positive 50p and will be set 20% below Max Position Profit So Far.
ie 50p - (50p*0.2)
= 50 - 10 for a lock of 40p Profit
This means if the Trade goes positve 50p, I will lock in a profit of 40p and be stopped out if it pulls back 10p from the Max Profit Price.

If the Trade continues to go my way from the 50p Profit mark, the TS will continue to move with it.
ie. The Trade goes 80p in profit, TS @ 80p-(80p*0.2)
=80 - 16 for a lock of 64p Profit.
And so on until I am either Stpped or Exited on TP.
Ignored
Hi Bemac,

Thanks again for your thorough explanation of your system. Everything seems to be falling into place now! But I must agree with Thom that it took me a couple of hours to understand how the TS and Stochs work.

  1. So just to make things clear for the Stochs, StDK - AvgStDK >= -10 is the code for both stochs having crested and turning up or down depending on whether it is a long or short entry respectively?
  2. What if one of the stochs is turning down and the other is turning up, would you still enter the trade? Especially since I noticed that the 2hr Stoch tends to give pretty high probability trades even if the 5min Stoch is disregarded.
  3. I am currently trading on an MT4 platform (which does not have 2hr charts). Will substituting the 2hr Stochs with 1hr or 4hr Stochs make a significant impact on the entry signal?
  4. With regard to whipsaws, what do you do if you have been stopped and reversed once but instead of having price reaching the TP, it reverses a second time? Do you stop and reverse the trade again? If so, at what point?

That's all for now!

P.S. Have you modified/tweaked your system since you first started trading it a year ago or has it withstood the test of time?

  • Post #33
  • Quote
  • Sep 6, 2007 7:47pm Sep 6, 2007 7:47pm
  •  Bemac
  • Joined Jan 2006 | Status: Monarch o' the Glen | 5,561 Posts
Quoting thehedge
Disliked
Hi Bemac,

Thanks again for your thorough explanation of your system. Everything seems to be falling into place now! But I must agree with Thom that it took me a couple of hours to understand how the TS and Stochs work.

  1. So just to make things clear for the Stochs, StDK - AvgStDK >= -10 is the code for both stochs having crested and turning up or down depending on whether it is a long or short entry respectively? Stohs can turn on a dime, especially on short Timeframes. If the HTFS {Higher TimeFrame Stohs =AvgStDK} are headed Down, then we want to give emphasis to Short Trades. BUT, I also want to Time my Entry. So... I want to post my Entry when the CTFS {Chart TimeFrame Stohs} are close to the Higher TF Stohs. In other words, the CTFS Stohs have sufficient room below them to suggest this could be a nice Short Entry Level. eg. IF HTFS Stohs have crested but CTFS are Close to the Bottom, It is not an optimum setup for Entry as the CTFS are telling me the Price could rise. Therefore, since it is not a Setup for this system, I Filter it out by using the Difference between the Stoh Values. Right or Wrong, right now, it's how the system works.
  2. What if one of the stochs is turning down and the other is turning up, would you still enter the trade? Especially since I noticed that the 2hr Stoch tends to give pretty high probability trades even if the 5min Stoch is disregarded. See Above
  3. I am currently trading on an MT4 platform (which does not have 2hr charts). Will substituting the 2hr Stochs with 1hr or 4hr Stochs make a significant impact on the entry signal? Hmm, Probably may require adusting the "Within -10" value
  4. With regard to whipsaws, "I mostly weather them." what do you do if you have been stopped and reversed once but instead of having price reaching the TP, it reverses a second time? Do you stop and reverse the trade again? If so, at what point?

That's all for now!

P.S. Have you modified/tweaked your system since you first started trading it a year ago or has it withstood the test of time?

Ignored
ps. Many times, mostly Before I started Trading it but, not much since then.
  • Post #34
  • Quote
  • Sep 7, 2007 1:11am Sep 7, 2007 1:11am
  •  thehedge
  • | Joined Jul 2007 | Status: Member | 26 Posts
Good day Bemac,

Thanks for your replies. Think I'm getting the drift concerning your use of Stochs. One last bit which still vexes me, however, is that if HTFS Stochs have bottomed out but CTFS are cresting at the top, wouldn't StDK - AvgStDK >= -10 (it would be very positive in fact)? Then although price could rise, it isn't an optimum entry, but the trade would still be entered. How do you overcome this limitation?

Thank you.
  • Post #35
  • Quote
  • Edited at 11:08pm Sep 23, 2007 10:56pm | Edited at 11:08pm
  •  Bemac
  • Joined Jan 2006 | Status: Monarch o' the Glen | 5,561 Posts
Quoting thehedge
Disliked
Good day Bemac,

Thanks for your replies. Think I'm getting the drift concerning your use of Stochs. One last bit which still vexes me, however, is that if HTFS Stochs have bottomed out but CTFS are cresting at the top, wouldn't StDK - AvgStDK >= -10 (it would be very positive in fact)? Then although price could rise, it isn't an optimum entry, but the trade would still be entered. How do you overcome this limitation?

Thank you.
Ignored
StDK - AvgStDK >= -10 The equation reads ABS(StDK-AvgStDK)<=10 {Less than or = to}If CTFS are Cresting, It is 'Supposed' that the price will Fall and Therefore, A Better "Timed' Entry is Yet to Come.
In other words; they have to be "Close" to being in Complience.
Sorry it took so long to reply.
  • Post #36
  • Quote
  • Last Post: Sep 29, 2007 1:02pm Sep 29, 2007 1:02pm
  •  thehedge
  • | Joined Jul 2007 | Status: Member | 26 Posts
Quoting Bemac
Disliked
StDK - AvgStDK >= -10 The equation reads ABS(StDK-AvgStDK)<=10 {Less than or = to}If CTFS are Cresting, It is 'Supposed' that the price will Fall and Therefore, A Better "Timed' Entry is Yet to Come.
In other words; they have to be "Close" to being in Complience.
Sorry it took so long to reply.
Ignored
Hi Bemac,

I can't seem to find the equation ABS(StDK-AvgStDK)<=10 in the formula. All I see is AND StDK - AvgStDK >= -10. Could you please point out where it is?

Which other pairs have you traded this system on and which of those pairs provide the highest returns?

Also, what is the maximum drawdown you have experienced on each pair you have traded with this system over the past year?
  • Trading Systems
  • /
  • Killer 'B' System Q & A
  • Reply to Thread
    • 1 Page 2
    • 1 Page 2
0 traders viewing now
Top of Page
  • Facebook
  • Twitter
About FF
  • Mission
  • Products
  • User Guide
  • Media Kit
  • Blog
  • Contact
FF Products
  • Forums
  • Trades
  • Calendar
  • News
  • Market
  • Brokers
  • Trade Explorer
FF Website
  • Homepage
  • Search
  • Members
  • Report a Bug
Follow FF
  • Facebook
  • Twitter

FF Sister Sites:

  • Metals Mine
  • Energy EXCH
  • Crypto Craft

Forex Factory® is a brand of Fair Economy, Inc.

Terms of Service / ©2021