Yeah, I tend to stick to ST trades, mate. 15m would be the highest I would go, but I like the 5m charts and occasionally even down to the 1m.
I liked PhilNet's 5mIntraday system. There was a lot more to it than met the eye, and it kinda forced one to look for the high-probability trades instead of jumping in every time there was a pull-back, so to speak.
I also like the Cornflower method.....not so much for the 1H charts, but I love to try scalping on the 5m Cornflower, using lever70's 5m MA's.
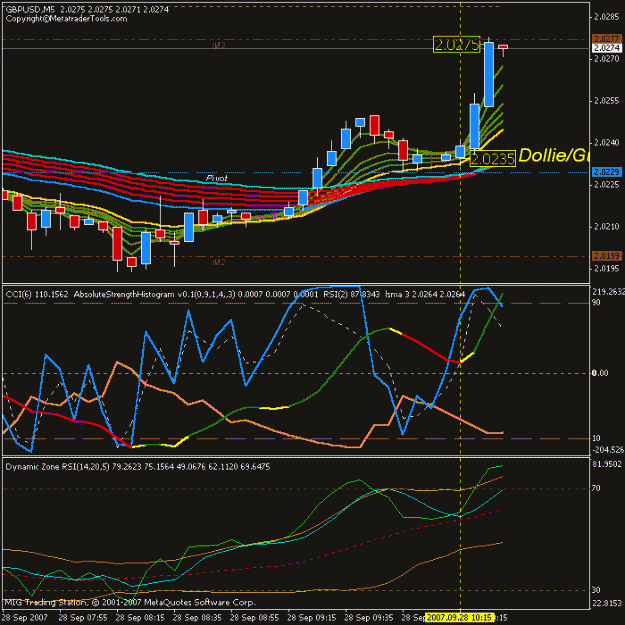
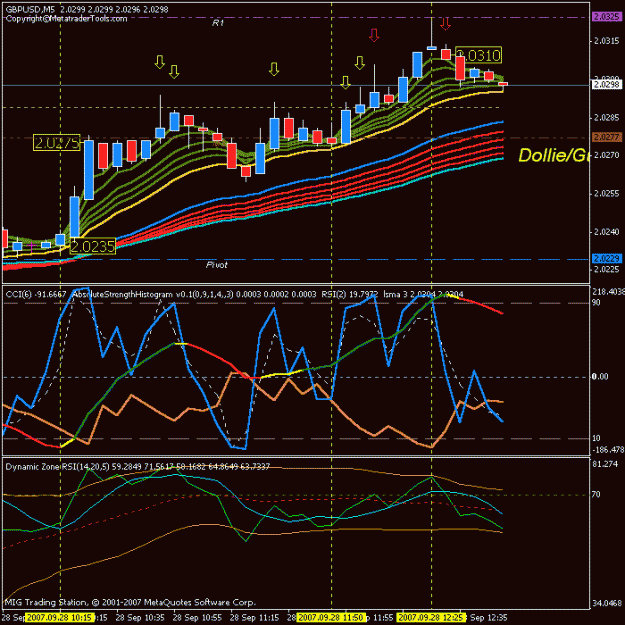
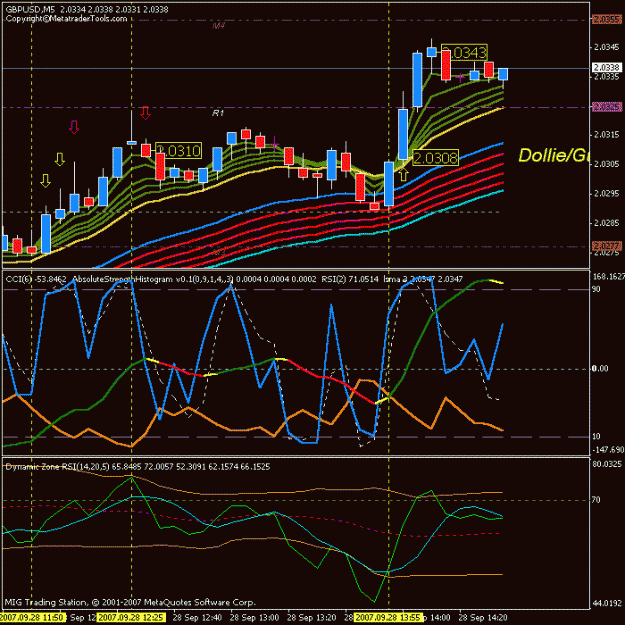
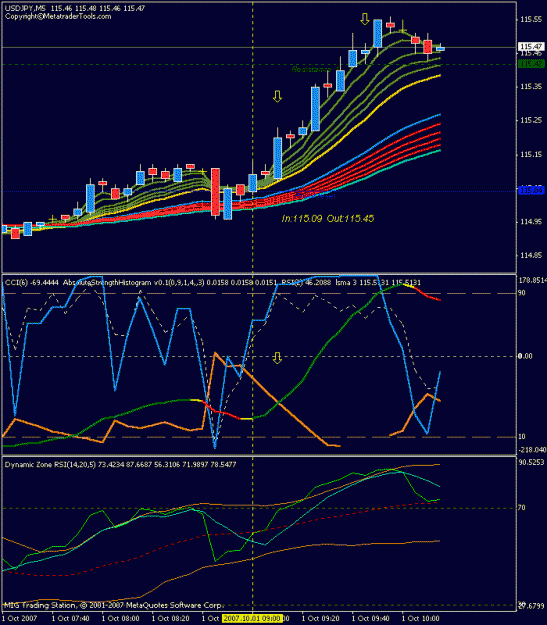
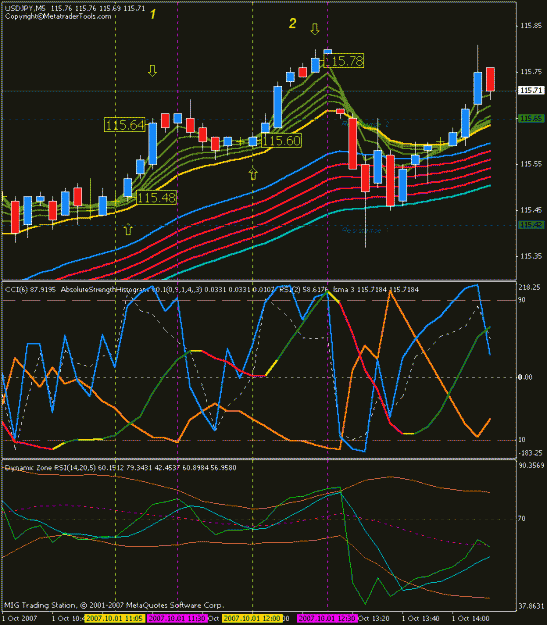
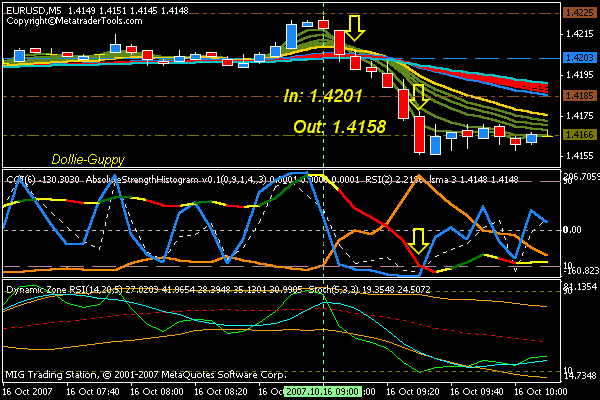
As for Dollie's system....I didn't really take to it when I first came across it. It seemed too much like hard work, keeping an eye on that middle window and all that was going on in there. However, I came back to it after a while, re-read the whole thread, and decided to try it again. I wasn't having a lot of success with Dollie's new method, so I reverted to the original one, but took the Dynamic Zone from the new one with me. That improved things, but still didn't seem quite "right", somehow. I tried various indicators and discarded them, until, just for a laugh really, I tried adding the Guppy, and was immediately struck at how it gave so much more of a visual indication of where price was likely to be headed. I don't usually like to use a lot of indicators as it only leads to confusion, but this particular combination seems simple to keep one's eye on, somehow.
What I call my "heads-up" of a possible development is the crossing of the green RSI line over the blue MA line in the bottom window. If it then crosses the middle red dotted band as well, it's looking good. I then look at the middle window to see what's happening in there, and if the various indicators look as if they're heading where I think they SHOULD be heading, then it's finger on the button time. Guppy, in combination with Pivot lines, usually shows me quite clearly where my potential entry point is, and the same combination is used for exits as well.
So far, it's come up trumps with only the odd loser, but even then, it's usually down to me not reading the signs properly. Best of luck with it, mate.
Cheers
I liked PhilNet's 5mIntraday system. There was a lot more to it than met the eye, and it kinda forced one to look for the high-probability trades instead of jumping in every time there was a pull-back, so to speak.
I also like the Cornflower method.....not so much for the 1H charts, but I love to try scalping on the 5m Cornflower, using lever70's 5m MA's.
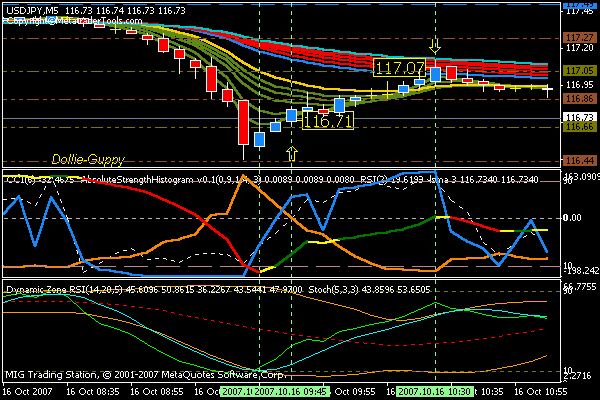
As for Dollie's system....I didn't really take to it when I first came across it. It seemed too much like hard work, keeping an eye on that middle window and all that was going on in there. However, I came back to it after a while, re-read the whole thread, and decided to try it again. I wasn't having a lot of success with Dollie's new method, so I reverted to the original one, but took the Dynamic Zone from the new one with me. That improved things, but still didn't seem quite "right", somehow. I tried various indicators and discarded them, until, just for a laugh really, I tried adding the Guppy, and was immediately struck at how it gave so much more of a visual indication of where price was likely to be headed. I don't usually like to use a lot of indicators as it only leads to confusion, but this particular combination seems simple to keep one's eye on, somehow.
What I call my "heads-up" of a possible development is the crossing of the green RSI line over the blue MA line in the bottom window. If it then crosses the middle red dotted band as well, it's looking good. I then look at the middle window to see what's happening in there, and if the various indicators look as if they're heading where I think they SHOULD be heading, then it's finger on the button time. Guppy, in combination with Pivot lines, usually shows me quite clearly where my potential entry point is, and the same combination is used for exits as well.
So far, it's come up trumps with only the odd loser, but even then, it's usually down to me not reading the signs properly. Best of luck with it, mate.
Cheers