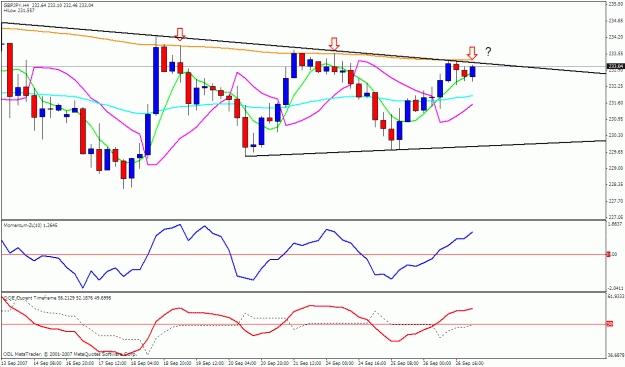
Just a thought here from the 4H chart. I know history doesn't always repeat itself, and there are no guarantees in Forex, but I thought this was interesting. Notice that the last two bounces off of the bearish trend line (which was also right at the 4H 200EMA) came down a bit and then ran back up a couple of candles later to retest the 200EMA area near the trend line (the first two arrows on chart). Price ultimately went down in both of these instances for some nice bearish pips. I only bring this to your attention because it looks like price is trying to break to the upside right now but it might just be another one of these head fakes to retest the 200EMA followed by a good move down. To me, the only thing that would convince me it has turned bullish would be a close above the 200EMA on the 4H chart. Just a thought, but then again I really don't know much about what I'm talking about.
M2B
M2B
Attached Image (click to enlarge)