DislikedHi all, great thread, so much to read, understand and hopefully learn from. I look forward to sharing many pips with you.
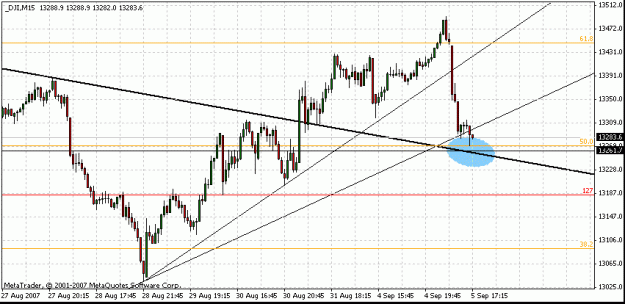
I have attached a chart of GBPJPY on which I have fib retracements for 1 hour, 4 hour, day, week and month - Can someone please explain why the manually drawn thick line (pink) is proving to be such a buffer for a reversal in the last two hours?
Thx.Ignored
 Auslanco - GBP/JPY and GBP/USD (newstrade)
- #21,785
- Sep 5, 2007 10:18am Sep 5, 2007 10:18am
- Joined Apr 2006 | Status: Trader | 2,429 Posts
TRIALS THAT SHAKE SOME, CONFIRM OTHERS!
- #21,786
- Sep 5, 2007 10:20am Sep 5, 2007 10:20am
- Joined Apr 2006 | Status: Trader | 2,429 Posts
TRIALS THAT SHAKE SOME, CONFIRM OTHERS!
- #21,792
- Sep 5, 2007 10:30am Sep 5, 2007 10:30am
- Joined Jul 2007 | Status: Never Give In | 2,518 Posts
Humble Lifetime Member
- #21,797
- Sep 5, 2007 10:50am Sep 5, 2007 10:50am
- Joined Aug 2007 | Status: The Weather Man | 8,859 Posts