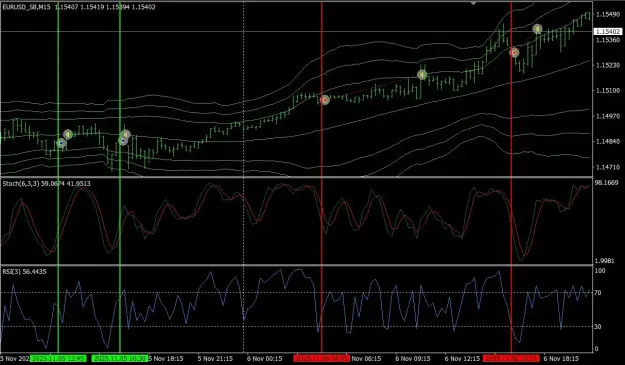
EA based on the rules to help test method only. Do NOT use on Live Account!!! Can be improved once tested. Also indicator to mark the buys and sells. {file} {file}
Ignored
Could you post a picture of what the indicator or EA is doing? I can't figure it out.
Of course. This is the EA and showing the indicator. If the logic is wrong please let me know.
On the indicator turn of the EMA filter. Which is based on your recommendation regarding 200 and 100 ema. If false EMAs not shown on EA.
Attached Image (click to enlarge)
Buy A. Break Condition (must happen first)
A BUY break is detected when ALL of the following are true on a closed candle:
Close < Lower Bollinger Band (50,2)
RSI(3) < 20
Stochastic %K(6,3,3) < 20
→ When this happens, set: BuyBreak = TRUE B. Re‑Entry Condition (entry trigger)
A BUY entry is triggered when ALL of the following are true on a later closed candle:
Close ≥ Lower Bollinger Band (50,2)
RSI(3) > 20
Stochastic %K ≥ 40
BuyBreak == TRUE
→ When this happens: Open BUYReset BuyBreak = FALSE C. EMA Filter (optional, same for EA & indicator)
If enabled:
If EMA100 OR EMA200 is inside the red Bollinger Band (50,2) → Do NOT allow BUY entry → Also reset BuyBreak = FALSE
Sell A. Break Condition (must happen first)
A SELL break is detected when ALL of the following are true on a closed candle:
Close > Upper Bollinger Band (50,2)
RSI(3) > 80
Stochastic %K(6,3,3) > 80
→ When this happens, set: SellBreak = TRUE B. Re‑Entry Condition (entry trigger)
A SELL entry is triggered when ALL of the following are true on a later closed candle:
Close ≤ Upper Bollinger Band (50,2)
RSI(3) < 80
Stochastic %K ≤ 60
SellBreak == TRUE
→ When this happens: Open SELLReset SellBreak = FALSE C. EMA Filter (optional, same for EA & indicator)
If enabled:
If EMA100 OR EMA200 is inside the red Bollinger Band (50,2) → Do NOT allow SELL entry → Also reset SellBreak = FALSE
ADDITIONAL RULES (Shared by EA & Indicator) 1. All conditions use CLOSED candles only
No real‑time / tick‑based evaluation. 2. Break and re‑entry can occur ANY number of bars apart
There is no fixed bar distance between break and re‑entry. 3. Only one break flag per direction
BuyBreak = TRUE until a valid BUY entry or invalidation
SellBreak = TRUE until a valid SELL entry or invalidation
4. Break is invalidated if EMA filter blocks entry
If EMA filter is ON and EMA is inside BB(50,2), both flags reset. 5. Indicator marks the candle where the EA would enter
Vertical line = the candle where re‑entry conditions are met.
This is the exact logic BOTH EA and indicator must follow
Hi everyone, a special shout-out to @pusztafie, thanks for the contribution.
I took this EUR/JPY entry at 15M on a demo account. Do you consider it a valid trade?
I would like to suggest a different filter for direction bias and strength from the knowledge kindly shared by Tyross based on moving averages association with price.
A simple moving average turns only when the new price entering the average is above or below the old price dropping out. So if you plot for example:
Current price, and
Price from 70 bars ago (for a 70‑period SMA)
…you can visually see when the SMA is about to turn.
The 70‑period SMA is the average of the last 70 closes. Each new bar:
Adds the current price
Removes the price from 70 bars ago
So the direction of the SMA depends entirely on the relationship between these two numbers. If current price > price 70 bars ago → SMA will start rising If current price < price 70 bars ago → SMA will start falling
This means the “price 70 bars ago” acts like a pivot threshold for the moving average.
Plotting the current price and the 70‑bars‑ago price gives you: 1. Trend Strength
The bigger the gap between current price and the 70‑bars‑ago price, the stronger the trend and the steeper the SMA slope.
2. Early Warning of MA Reversals
When current price approaches the 70‑bars‑ago price, the SMA is losing momentum and may flatten soon.
When current price crosses it, the SMA must change direction shortly after.
3. Predictive Power
You can literally see future SMA turning points before they happen because the SMA is mathematically forced to follow the relationship between these two prices.
Practical Interpretation
If price is far above the 70‑bars‑ago price → strong uptrend, SMA rising
If price is far below → strong downtrend, SMA falling
If price is converging toward the 70‑bars‑ago price → trend weakening
If price crosses it → SMA direction change is imminent
This gives you a leading indicator for a traditionally lagging indicator.
In this example we would plot 1 sma shifted 70, we see the price 70 bars ago on the the current bars.
Even though an EMA doesn’t “drop” the price from 70 bars ago the way an SMA does, the direction of the EMA still depends entirely on whether the current price is above or below the EMA’s own value.
And the EMA’s value is itself a weighted blend of past prices — with the heaviest weight on the most recent ones and exponentially decreasing weights on older ones.
An EMA rises only when the current price is above the EMA.An EMA falls only when the current price is below the EMA.
But what determines whether the EMA is above or below its past values? The same principle as the SMA:
If current price is consistently higher than the prices from many bars ago, the EMA will be pulled upward.
If current price is consistently lower, the EMA will be pulled downward.
So while the EMA doesn’t have a single “drop‑off” price like the SMA, the relationship between current price and past prices still governs its slope.
I hope this maybe of help. If not, please delete this post as it is not my wish to disrupt your thread.
Hi everyone, a special shout-out to @pusztafie, thanks for the contribution. I took this EUR/JPY entry at 15M on a demo account. Do you consider it a valid trade?{image} Greetings to all!
Ignored
I updated post 1 based on the recommendation of my dear friend Hasib. Please read it and update your indicators. Set stoch levels to 80,60,40. Add SMA as well, this was recommended by Ronin, to whom I am very grateful for his contribution.
Of course. This is the EA and showing the indicator. If the logic is wrong please let me know. On the indicator turn of the EMA filter. Which is based on your recommendation regarding 200 and 100 ema. If false EMAs not shown on EA. {image} Buy A. Break Condition (must happen first) A BUY break is detected when ALL of the following are true on a closed candle: Close < Lower Bollinger Band (50,2) RSI(3) < 20 Stochastic %K(6,3,3) < 20 → When this happens, set: BuyBreak = TRUE B. Re‑Entry Condition (entry trigger) A BUY entry is triggered...
Ignored
The logic is perfect. Could you change the EA to match the posted 1st post, please?
{quote} I updated post 1 based on the recommendation of my dear friend Hasib. Please read it and update your indicators. Set stoch levels to 80,60,40. Add SMA as well, this was recommended by Ronin, to whom I am very grateful for his contribution.
Ignored
Excuse me, I have a question. The levels used for RSI are 70, 50, and 30. For stochastic oscillator, are they 80, 60, 40, and 20?
Thank you for your clarification
{quote} Excuse me, I have a question. The levels used for RSI are 70, 50, and 30. For stochastic oscillator, are they 80, 60, 40, and 20? Thank you for your clarification
Bollinger / RSI / Stochastic Break–Reentry Strategy (Full Logic Summary) Used by both the Expert Advisor (EA) and the Indicator 1. Indicators Used
Bollinger Bands (Period 50):
Red bands: deviation 2 (main signal band)
Yellow bands: deviation 3 (SL option 1)
Dark orange bands: deviation 4 (SL option 2)
Midline: SMA(50)
RSI: period 7
Stochastic: %K 14, %D 3, Slowing 3
Trend Filter:
SMA(50) on H4 timeframe
BUY only if price is above SMA50 H4
SELL only if price is below SMA50 H4
2. BUY Logic A. Break Condition (oversold breakout)
A BUY setup becomes “armed” when all are true on a closed candle:
Price closes below the lower red BB (50,2)
RSI(7) is below 30
Stochastic %K is below 20
→ Set BuyBreak = TRUE B. Re‑Entry Condition (entry trigger)
A BUY entry occurs when all are true on a later closed candle:
Price closes back above or on the lower red BB
RSI(7) is above 30
Stochastic %K is 40 or higher
BuyBreak == TRUE
Price is above SMA50 on H4 (trend filter)
→ Open BUY → Reset BuyBreak = FALSE C. BUY Stop Loss Options (handled automatically by EA)
The EA uses the input SL_Mode to choose the stop loss:
SL_Mode = 0: SL = lower yellow BB (50,3)
SL_Mode = 1: SL = lower dark orange BB (50,4)
You do not choose manually — the EA applies the selected mode. D. BUY Take Profit Options (handled automatically by EA)
The EA uses the input TP_Mode to choose the take profit:
TP_Mode = 0: TP = midline BB (SMA50)
TP_Mode = 1: TP = upper red BB (50,2)
Again, the EA applies this automatically. 3. SELL Logic A. Break Condition (overbought breakout)
A SELL setup becomes “armed” when all are true on a closed candle:
Price closes above the upper red BB (50,2)
RSI(7) is above 70
Stochastic %K is above 80
→ Set SellBreak = TRUE B. Re‑Entry Condition (entry trigger)
A SELL entry occurs when all are true on a later closed candle:
Price closes back below or on the upper red BB
RSI(7) is below 70
Stochastic %K is 60 or lower
SellBreak == TRUE
Price is below SMA50 on H4 (trend filter)
→ Open SELL → Reset SellBreak = FALSE C. SELL Stop Loss Options (handled automatically by EA)
The EA uses SL_Mode:
SL_Mode = 0: SL = upper yellow BB (50,3)
SL_Mode = 1: SL = upper dark orange BB (50,4)
D. SELL Take Profit Options (handled automatically by EA)
The EA uses TP_Mode:
TP_Mode = 0: TP = midline BB (SMA50)
TP_Mode = 1: TP = lower red BB (50,2)
4. Additional EA Rules
Uses closed candles only
Only one trade per symbol at a time
Spread filter
Trading hours filter
All indicator settings are user‑configurable
No EMA100/200 used anywhere
5. Indicator Behaviour
Uses the exact same logic as the EA
Draws a vertical line on the candle where the EA would enter