Explanation from mrtools
The Repulse indicator measures market bullish or bearish pressure, calculated as the difference between positive and negative forces, often using EMAs or price-based ratios.
Price-Based Formula:
Calculates Repulse using candlestick prices:
Repulse = (Close – Open) / (High – Low)
This value is then averaged over a defined interval (commonly 5, 15, or 33 bars) using a moving average to smooth the signal. Positive values indicate buying. pressure, and negative values indicate selling pressure.
Interpretation
- Positive Repulse: Indicates that buyers are dominating, suggesting bullish momentum.
- Negative Repulse: Indicates that sellers are dominating, suggesting bearish momentum.
- Oscillation Around Zero: The zero line serves as a midline dividing bullish and bearish conditions. Traders often look for divergences or trend confirmations relative to price movements.
- This version is the price-based version, using an assortment of average and price options with a choice of floating levels, Donchian channel, or Quantile bands. Coloring options are outer levels cross, middle level cross, or slope change.
Now to the explanation of the system;
I am actually using two indicators, the Repulse was made by mrtools and the p207 alerts, I believe, was made by mladen. When I saw it I was intrigued and once on the chart I was able to find some settings that looked promising on the Gold 1M chart (this is my go to TF and pair now).
On The indicator you can see primarily a wave of dots in blue, orange and grey. There is also a red and blue dot on the chart when the blue or orange dots show up on the indicator.
For a buy trade when the blue dots start on the repulse indicator and it prints a blue dot below a candle I wait for a green dot to print, from the Ptl207 indicator, which must also have a blue dot in the repulse indicator. Use that candles close for the entry, a 10 pip SL for the calculation for position size. Please note there is no 10 pip SL it is only for position size calculation.
The SL and TP are simply 6R for the SL and 12R for the TP (the initial R is determined by the close and a 10 pip Sl.
There is one other way a trade closes beside hitting the SL or TP, which is, if we reach 6R in profit we move to BE.
The sells are done exactly the opposite.
Here is a chart to show what it looks like then I will show some examples.

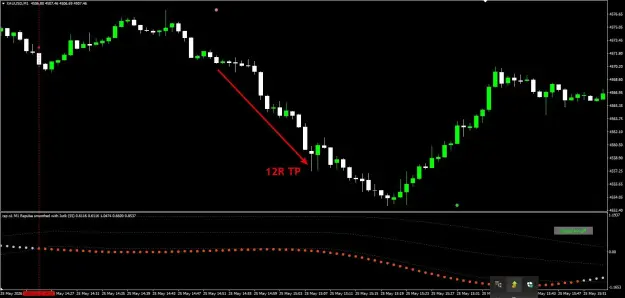
Now here is an example showing 12R TP hit.
Here is an example showing 6R SL.

Here is an example showing a BE trade.

My initial testing only covers the charts from May 18th to May 26th on the Gold 1M chart which I know isn't a ton of data but it has shown significant results and prompted me to go ahead and start this thread.
The results are as follows;
I achieved a total of 48R...I trade a $5,000.00 dollar account and each trade would be $100.00 so that equates to a 8 day total of $4,800.00
I will leave it there and post the indicator and the settings I am using and we will see where we get to...
Chris
Here are the settings, the ones not shown are just default.


Now please go to post 34 for the actual start to this thread.


