Dislikedwell what i had in mind when i wrote the previous comment was that NQ futures is in a huge rally. From aprox 23.000 points on 1st of april to almost 29.500 on the 12th of may. Selling at any point would have got you destroyed. I found it interesting that your prediction timings did not foresee any sell during this week except on tuesday evening and some on Friday. That's what i find fascinating. If a timing is "not simply a BUY or SELL signal" then how did you figure out nq is more likely to buy than to sell? Thanks {image} {image}Ignored
Since I physically cannot deeply monitor a large number of financial instruments at the same time, I truly appreciate the feedback, observations and involvement of other traders in this research.
The calculation of timings, movement probability and potential movement range is based on mathematical models and many years of studying market behavior through time.
Unfortunately, I cannot disclose the detailed structure of the model or calculations at this stage.
However, the main purpose of this thread is to openly explore how markets react around specific time structures and Liquidity Activation Points.
Best regards,
Iryna
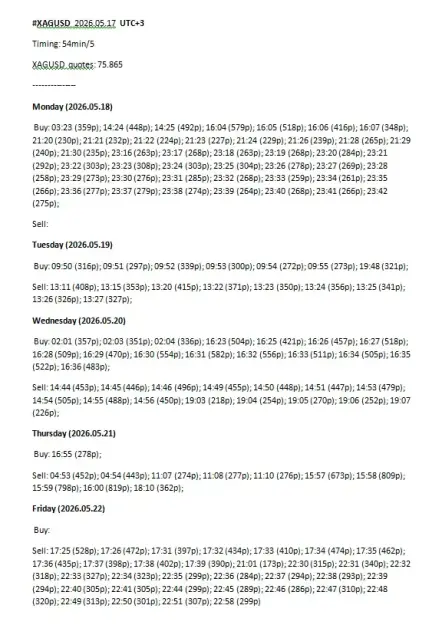
The system projects time, direction, and expected movement
through Liquidity Activation Points (timings).
#scalping #MarketStructure #TimeTrading
Timing-Based Market Forecasting System
2