Attached Image (click to enlarge)

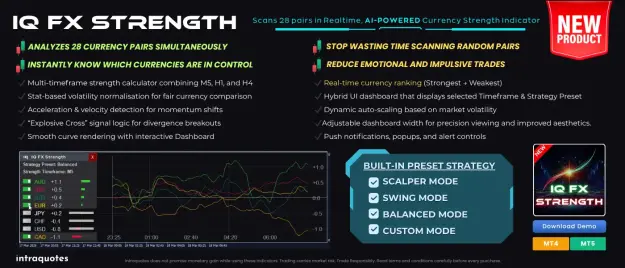
First question first.. How did we find this particular pair that is showing good movement and not in a range? With IQ FX Strength, a handy tool that shows the Strongest vs. weakest currency in a jiffy through a strength dashboard based on the timeframe you choose.
We chose M5, and the indicator instantly showed USD as the strongest and NZD as the weakest in real-time.
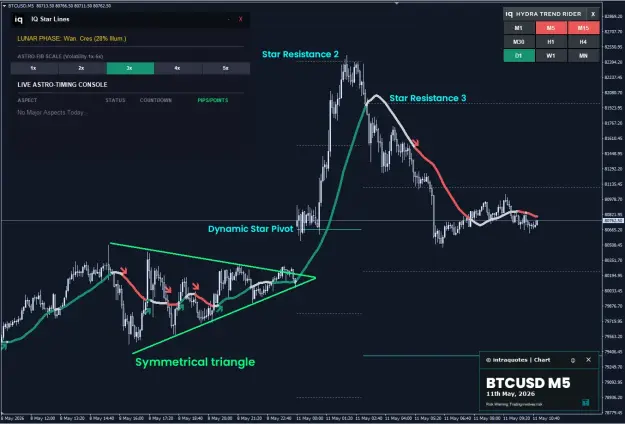
Once we opened the NZDUSD chart, the picture was clear.
The NZDUSD chart displays a clean bearish trend that followed all the Gann Levels precisely and covered more than 30 pips just during the ongoing the Asian Session alone. Wait, what is 'Gann Levels' you ask? It is a one-of-a-kind Gann Intraday Trading tool that traders are getting obsessed with. It pre-plots all the upcoming Gann Support & Resistance levels instantly on your chart so you stay ahead and plan your entry & exit accordingly. How cool is that?
Wanna know them in a bit more detail? Keep reading
IQ FX Strength tells you which pair is tradable, which symbol is strongest, and which one is weakest.
Displays all the hidden, powerful Gann support & resistance levels on the chart in advance, where the price reacts precisely.
About the Indicator: Gann trading principles have stood the test of time, and our IQ FX GANN LEVELS indicator makes them even more powerful! It maps out high-probability market levels where price reactions are likely, helping you anticipate the next big move before it happens.
intraquotes.com