Hi all
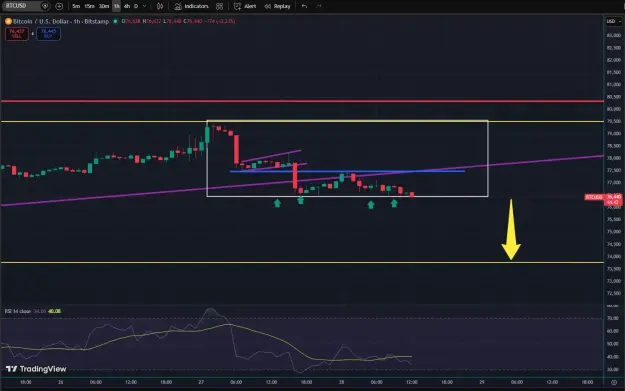
Price broke the trend line and tried to retake it without any success.
The stock market is weak (retracing) and the correlation seems to be playing out
I am looking for 74k when yesterday's low goes.
On the chart the yellow box is the previous week's price action while the white box is yesterday's price action
The top red line is the 80k resistance line
Lastly, the lower white line is the bear flag lower line as I have shown on my weekly chart before.
That line meets price at 70k. That might be a bit of a stretch right now.
Edit: Added the daily chart. It show the trend line break and my boxes better
Attached Image(s) (click to enlarge)


If you think you can or cannot do it you are correct
1