{quote} i agree, and already took some profit 1/2 of the orders at 3313 i will waiting for some pump before another short. as for GOLD watching possible short slightly above 4500 area again before another major drop to below 4000 {image}
Ignored
Whale, here is the daily chart. I need to update the 30M gold spot chart b/c I trade micro gold futures (MGC)
Attached Image (click to enlarge)
Always trade your own plan...I don't provide trading signals.
{quote} Whale, here is the daily chart. I need to update the 30M gold spot chart b/c I trade micro gold futures (MGC) {image}
Ignored
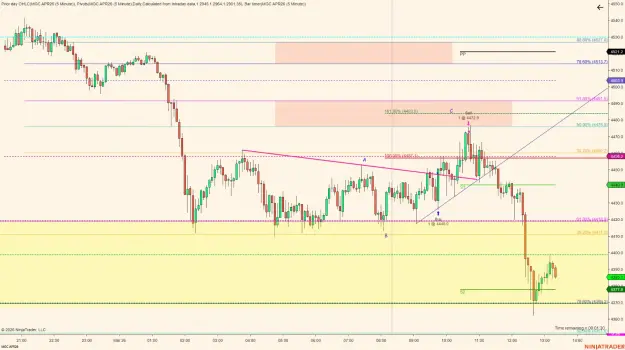
It seems that gold has found support for today. We trade away from the decision box after the trade is activated with PA on the 5M chart. Stop-loss is about $200 (MGC;$10 per point)
Attached Image (click to enlarge)
Always trade your own plan...I don't provide trading signals.
{quote} don’t you think the 4th of the up cycle should break (3886)?
Ignored
Whale, the daily ATR (14) for gold is 180 pips/points, so I don't look for 4H or daily charts to trade off b/c my stop-loss would have to be about $2700. I'm not willing to risk that kind of money. 3886 on the daily chart is a possible target b/c gold hasn't yet reached the timing for a correction.
Always trade your own plan...I don't provide trading signals.
{quote} It seems that gold has found support for today. We trade away from the decision box after the trade is activated with PA on the 5M chart. Stop-loss is about $200 (MGC;$10 per point) {image}
{quote} It seems that gold has found support for today. We trade away from the decision box after the trade is activated with PA on the 5M chart. Stop-loss is about $200 (MGC;$10 per point) {image}
Ignored
Decision zone on the 30M chart, entry on the 5M trigger chart. We never know in advance which zone will hold, that's why the PA on the trigger chart tells us when to enter the trade.
Attached Image (click to enlarge)
Always trade your own plan...I don't provide trading signals.
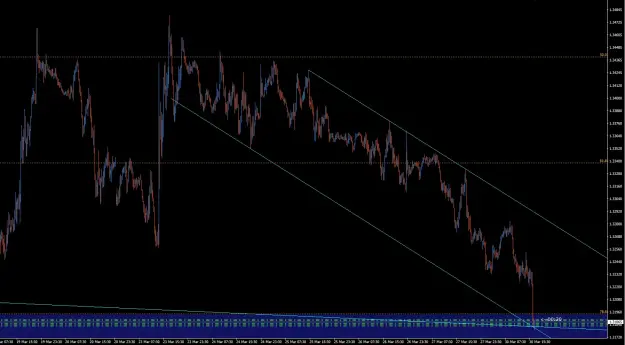
{quote} Whale, nice entry. Let's, for now, target 1.3309 and 1.3293, and as low as 1.3259 for today. Just remember, any number in the yellow box can reverse the trend on the 30M chart. {image}
Ignored
In GU, the second zone stopped advancement. When the trade is triggered, take what the market offers you, 20/30 pips. That's fine, just get paid for the time spent in front of the computer. Sure, you can hold for the targets from HTFs (1H,4H, daily)
Attached Image (click to enlarge)
Always trade your own plan...I don't provide trading signals.
{quote} Whale, nice entry. Let's, for now, target 1.3309 and 1.3293, and as low as 1.3259 for today. Just remember, any number in the yellow box can reverse the trend on the 30M chart. {image}
Ignored
1.3269 and 1.3234 levels to watch for potential LOD. The long-awaited 1.3195 is looming in the background.
Attached Image (click to enlarge)
I corrected the S1 level.
Always trade your own plan...I don't provide trading signals.
{quote} Decision zone on the 30M chart, entry on the 5M trigger chart. We never know in advance which zone will hold, that's why the PA on the trigger chart tells us when to enter the trade. {image}
Ignored
Friday bonus, gold 30M.
Attached Image (click to enlarge)
Always trade your own plan...I don't provide trading signals.
{quote} Case study...Last week's PA on 30M TF. {image}
Ignored
GU made the move to the upside of 59 pips overnight and is now sitting in the potential reversal zone for the day. Strong resistance zone is between 1.3280 and 1.3290.
Attached Image (click to enlarge)
Always trade your own plan...I don't provide trading signals.
{quote} GU made the move to the upside of 59 pips overnight and is now sitting in the potential reversal zone for the day. Strong resistance zone is between 1.3280 and 1.3290. {image}
Ignored
H4 chart: I see it exactly the same way you do (blue weekly buying zone), and I'm buying
1.3140 is very important for me also
Attached Image (click to enlarge)
trading is like dancing, don't think and just listen to the music!
{quote} Whale, correct, same thinking. We still don't know if wave 5 is in place; that's why on my daily chart I marked it with 3 question marks (???). It might be why trading is so sluggish. {image} Added: The low on March 13th @1.3217 can be part of the BC swing and is not necessarily the end of wave 5. {quote}
Ignored
Now we should target 1.3148 on the daily TF; the first level in the zone for potential end of wave 5.
Attached Image (click to enlarge)
15M chart, setups for today only.
Attached Image (click to enlarge)
Always trade your own plan...I don't provide trading signals.
{quote} H4 chart: I see it exactly the same way you do (blue weekly buying zone), and I'm buying 1.3140 is very important for me also {image}
Ignored
birdland, the standard zone for the end of wave 5, is a big one (1.3148-1.3057). So follow PA in this zone when GU gets there on a smaller TF to pinpoint the reversal.
Attached Image (click to enlarge)
Attached Image (click to enlarge)
I adjusted the channel b/c a new low was made.
Always trade your own plan...I don't provide trading signals.
{quote} Now we should target 1.3148 on the daily TF; the first level in the zone for potential end of wave 5. {image} 15M chart, setups for today only.{image}
Ignored
After the weekly target was hit, there was a strong upside reversal. GU is approaching the resistance zone for today between 1.3248 and 1.3285.
Attached Image (click to enlarge)
Always trade your own plan...I don't provide trading signals.