My approach is heavily based on Price Action, with the help of some indicators. In terms of indicators, I use a 8-period SMA channel of the Highs & Lows, that helps me gauge momentum & direction. My execution TF is M5, my HTF is H1.
Here’s what my chart looks like:

I have HTF levels automatically traced, I use the previous 2 day / week / month High & Low as potential targets / reversal zones. Those levels are marked as dotted lines on my chart, with various colors (depending on H/L, and TF). For me, a HTF level is a HTF level, and I don’t apply more “weight” if it’s say a Weekly Low compared to a Daily Low. It’s just a simple no-brainer and objective way to have levels & targets. Obviously, I pay more attention to zones that have 2+ HTF levels clustered close together.
And for HTF momentum & direction, I use the same 8-period SMA channel of the Highs & Lows, but for the H1 TF. It’s a HTF indicator, which explains the “stairs” effect. Generally speaking, I want to trade in conditions where the M5 channel is outside the H1 channel. This confirms that there is both momentum and direction.
Finally, I have the Asian range traced out (with a % being in relation to the average range of that Asian session (average of the past 14 Asian sessions). It gives me a sense of the relative momentum for the day.
As a visual aid, I have my SMA channel be green when both high & low are going up, red when both are going down.
There have been many different trading strategies using a similar approach, here are a couple:
https://www.forexstrategiesresources...erage-channel/
https://www.tradingsetupsreview.com/...nel-day-trade/
https://www.tradingview.com/script/o...-Buy-and-Sell/
https://www.forexfactory.com/thread/...rt-term-system
I use a channel “rotation” approach in quite a few ways:
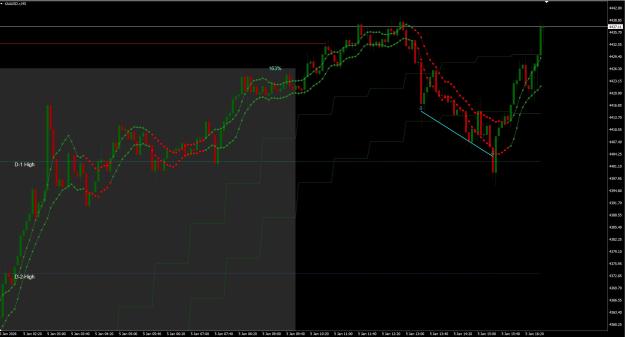
- Continuation after a pullback


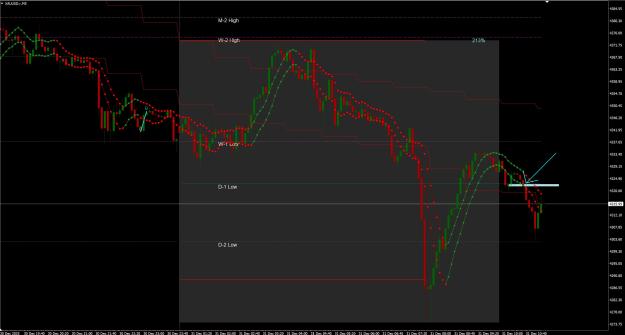
- Reversals. Price needs to have moved away from my baseline (H1 channel), I measure it in terms of the number of ATRs between the 2 channels, I have a threshold above which I can consider it a potentially valid reversal. Ideally it needs to happen at one of my HTF levels (or a swing level that I have manually marked).


That’s the basis of my setups. In terms of targets, I have a few ways I set them:
- TP based on a measured move
- TP based on previous support / resistance
- TP at HTF level
- Letting the trade run until the next reversal.
In terms of SL, I simply look at the level printed at the fresh rotation

Going back to Price Action, I look at a few things:
- How clean the previous intraday swing moves have been (effort-result aspect; number of failures; body-wick ratios; …)
- During the day, where price is at vs the Asian Range (consolidation or range expansion).
- How efficient price is at making new highs / lows for the day
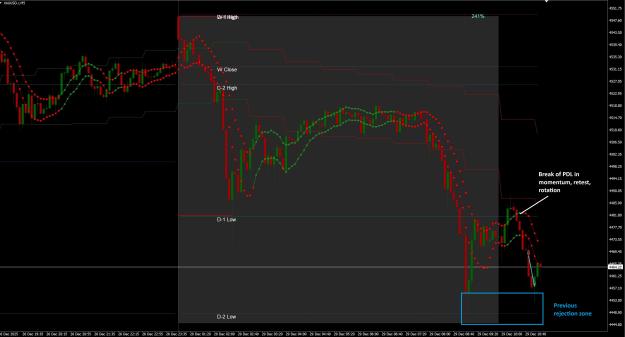
- I gauge short-term momentum with how the bars form relative to the M5 channel. On a momentum move / leg / wave, I want the bars to mostly form outside the channel (free bars). When bars close back inside the channel, I want that pullback move to very quickly fail. Bars closing on the opposite side of the channel are indicative of the end of that leg, and potentially a next rotation (or start of consolidation zone).
In terms of entries, depending on my conviction of a potential setup, and depending on the implied momentum, I can wait for certain confirmations, or have what may seem as a late entry.
What I look for in a “valid” rotation:
- For price to cleanly stall or fail at some point (no big wicks in both directions, no hectic movement).
- Confluence with HTF level is better
- I then want to see momentum gaining on the creation of the fresh rotation, with a bar closing with conviction above / below the channel, with little upper / lower wick. The ATR size of that bar should be relatively large.
I try to build a narrative around the setup (usually based on continuation or failure), within the current market structure.
This method is just another way of looking at HHs and LLs, breaks of structure, continuations and mean reversion. Nothing groundbreaking, I just framed it a certain way based on a combination of methods I learned during my journey.