"FOLLOW THE PLAN, SHOW ME THE FAILURE"
Dear Trader/Technical Analyst/Expert Advisors:
By grace of Almighty God i created this thread with name as ICS which is the name of trading system.
I done lot of research on how to analyse price & time. Almost 12years of study. Patience to invest 12years of time is only because of grace of my Guruji Sant Rampal Ji Maharaj. In one word He is everything to me. Without his blessings I would not be here to discuss things unconditionally. I open the thread here to share with you and welcomes to you to discuss here. Our mind or ego always says do not disclose your method to public. But you know, i asked myself why it is so? Whatever the idea induced in our mind it is not ours. It is the asset of Almighty god. So where is point of saying things is ours here???. Just for reference purpose we define ourself that, we are doing and he is doing. But in reality each and every moment was done by grace of Almighty God only. If our breath count stops one fraction of second we are no more here on this planet. So this is my believeness on my Guruji whose teachings are completely free and unconditional. So we all are the childrens of one Supreme God. Our Guruji Says gain in each and every rupee or dolloars is nothing but accumulation of a sin. Irrespective of religion and cast, if we follow the "Right Way of Worship" with reference to any holy scripture then only we can accumulate the virtue. Hence be positive in this thread. So my humble request do not do business with the strategy presented here. Instead share to someone with free of cost if you feel benifit and satisfy by yourself first. So that everyone can get benifit unconditionally. Please note that i saw lot of materials including gaan studies, use of indicators and journals papers published on major global academic publisher like Elsevier(www.sciencedirect.com) etc. After all i realized that we have to look at trading as as a Professional not as a gamble. Hence we have to educate any thing before we do in action. Please note that everyone has different style of understanding at finanical market based on his mind set level. we should not blame to any one. Only thing is, we have to know the reality. In our education system we might have been studied or known two fundamental economic forces called Supply & Demand which determines the prices in the market. Our assumption is, we want to see market how it behaves based on supply and demand by analysing the Products (i.e. Time which is constant on X axis) and Price (i.e. Price which is variable on Y-Axis) as simple as that. In this system i did not use any indicators. Pure and clear time & price analysis on X-Y axis. I use only naked chart with horizontal lines (to mark price levels) and vertical lines (to mark time levels) on X-Y chart. so we need to keep things very simple to easily understand price behaviour and gain the knowledge & experience from it. Remember visible assets can be stolen someone from us. But the gained knowledge and experience no one can be stolen. Our guruji always teaches that: "Believing in God, being a kind person, doing a Right Way of Living, sharing a knowledge and experience is always occupation of place in the heart of Almighty God" (To know more about his teachings you can visit their non profit organization website www.jagatgururampalji.org). So nothing is wrong if we share the knowledge and experience gained with others, It is the benifit for the community and whole society only not for individual as long as we are in limits of our boundary. Thanks for the platform forexfactory for giving an opportunity to share the knowledge and experience gained and discuss the things here.
-------------------
Updated on 14-05-2026 (By god grace its took me sometime how to draw the line on the chart by assuming Price=Time [or] Time=Price. Along with this, what we need to observe is Identifying the particular type of pattern also place an Important role to analyse the supply and demand in financial markets. Below is the visual model/pattern of ICS updated with specification)
Visual Model of ICS_from entry to exit (i.e. Parameter P to Q)

---------------------------------------------------------------------------------------------------------------------------------------------------------
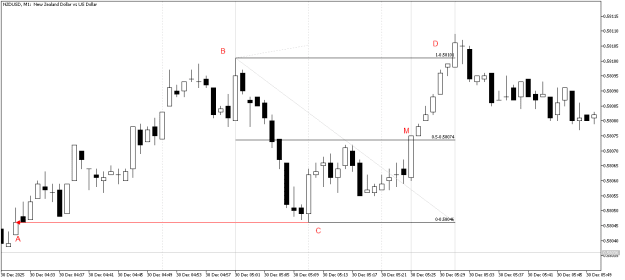
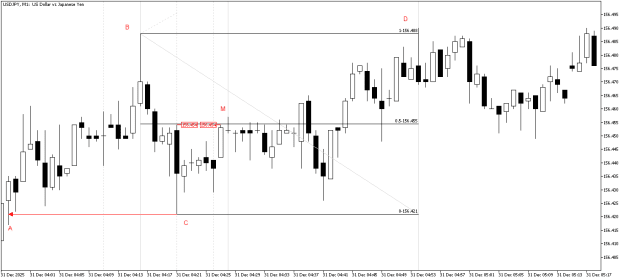
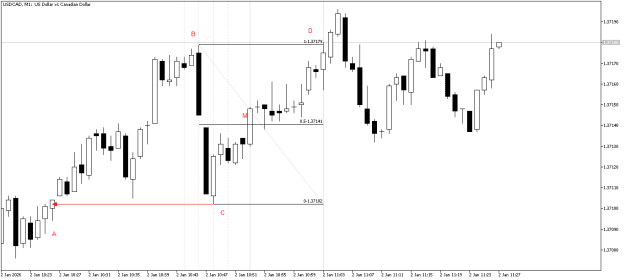
Real Example of ICS_from entry to exit (i.e. Parameter P to Q)

NOTE: Bottom attached is the Excel file is CALCULATOR to find VOLUME, LOT SIZE, STOP OUT PRICE at 50% of DD download it if needed.
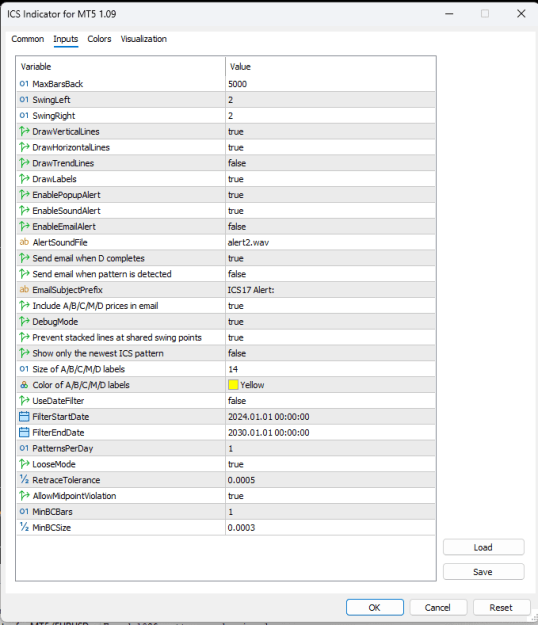
From the above real example how do we calculate VOLUME, LOT SIZE, STOP OUT PRICE at 50% of DD is explained below from the screen shot of Excel Calculator for General Understanding:

1. For any propfirm challenge we purchase, we generally know un variable inputs like
-Challenge Account size
-Maximum Draw Down (MDD)
-Daily Drawdown(DD)
-Volume of 1 Standard Lot
-Minimum Step size in Lot
-Value of M & R (it is to be fixed by Us to Manage the Risk)
The above inputs to be fixed one time in Excel Calculator file as you see from Screen shot of image or from Attached Excel Sheet
2. Only two variable inputs to be given by us i.e. Entry price & Target price whenever setup presents
For current setup of NZDUSD pair:
Entry price at D=0.58436USD, Target price level at A=0.58301USD
3. we get output parameters Like
VOLUME=9259.26NZD [or]
LOT SIZE=0.09NZD
STOP OUT PRICE required at 50% OF DD=0.85436USD
4. Make sure Check in Row 21 must display "OK" if "NOT OK" try to increase the "R" in Row 6 till we get "OK".
Note: Please feel free to share your thoughts from general discussion from the above current example if any..
---------------------------------------------------------------------------------------------------------------------------------------------------------
NOTE: Definition of Swing high & Swing Low
swing high: recent highest or equal high bar with either side bars as lower highs. (whenever equal high appear we chose recent equal high as swing high bar)
swing low: recent lowest or equal low bar with either side bars as higher lows. (whenever equal low appear we chose recent equal low as swing low bar)
actually it is simple 3bars swing i.e. one left (i+1) and one right side (i-1) to swing high bar(i) which is called as middle bar. (so total 3bars to qualify as swing)
Please see the Example of Swing High and Swing Low Identification from chart:

------------------------------------------
Thanks & Regards
NOTE1: It is Mechanically Rules Based ICS System. Kindly backtest on your own before take any Live Trades.
NOTE2: Real time forward examples from Post #99 onwards (updated on 16.04.2026)
(link for the post #99 : https://www.forexfactory.com/thread/...9#post15704499 )
NOTE3: Investor in the Gold be caution look at Post #83
(link for the post #83 : https://www.forexfactory.com/thread/...5#post15634065 )
Dear Trader/Technical Analyst/Expert Advisors:
By grace of Almighty God i created this thread with name as ICS which is the name of trading system.
I done lot of research on how to analyse price & time. Almost 12years of study. Patience to invest 12years of time is only because of grace of my Guruji Sant Rampal Ji Maharaj. In one word He is everything to me. Without his blessings I would not be here to discuss things unconditionally. I open the thread here to share with you and welcomes to you to discuss here. Our mind or ego always says do not disclose your method to public. But you know, i asked myself why it is so? Whatever the idea induced in our mind it is not ours. It is the asset of Almighty god. So where is point of saying things is ours here???. Just for reference purpose we define ourself that, we are doing and he is doing. But in reality each and every moment was done by grace of Almighty God only. If our breath count stops one fraction of second we are no more here on this planet. So this is my believeness on my Guruji whose teachings are completely free and unconditional. So we all are the childrens of one Supreme God. Our Guruji Says gain in each and every rupee or dolloars is nothing but accumulation of a sin. Irrespective of religion and cast, if we follow the "Right Way of Worship" with reference to any holy scripture then only we can accumulate the virtue. Hence be positive in this thread. So my humble request do not do business with the strategy presented here. Instead share to someone with free of cost if you feel benifit and satisfy by yourself first. So that everyone can get benifit unconditionally. Please note that i saw lot of materials including gaan studies, use of indicators and journals papers published on major global academic publisher like Elsevier(www.sciencedirect.com) etc. After all i realized that we have to look at trading as as a Professional not as a gamble. Hence we have to educate any thing before we do in action. Please note that everyone has different style of understanding at finanical market based on his mind set level. we should not blame to any one. Only thing is, we have to know the reality. In our education system we might have been studied or known two fundamental economic forces called Supply & Demand which determines the prices in the market. Our assumption is, we want to see market how it behaves based on supply and demand by analysing the Products (i.e. Time which is constant on X axis) and Price (i.e. Price which is variable on Y-Axis) as simple as that. In this system i did not use any indicators. Pure and clear time & price analysis on X-Y axis. I use only naked chart with horizontal lines (to mark price levels) and vertical lines (to mark time levels) on X-Y chart. so we need to keep things very simple to easily understand price behaviour and gain the knowledge & experience from it. Remember visible assets can be stolen someone from us. But the gained knowledge and experience no one can be stolen. Our guruji always teaches that: "Believing in God, being a kind person, doing a Right Way of Living, sharing a knowledge and experience is always occupation of place in the heart of Almighty God" (To know more about his teachings you can visit their non profit organization website www.jagatgururampalji.org). So nothing is wrong if we share the knowledge and experience gained with others, It is the benifit for the community and whole society only not for individual as long as we are in limits of our boundary. Thanks for the platform forexfactory for giving an opportunity to share the knowledge and experience gained and discuss the things here.
-------------------
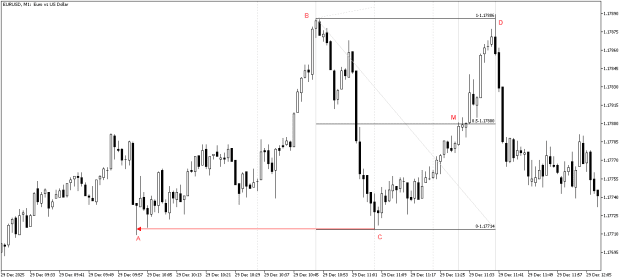
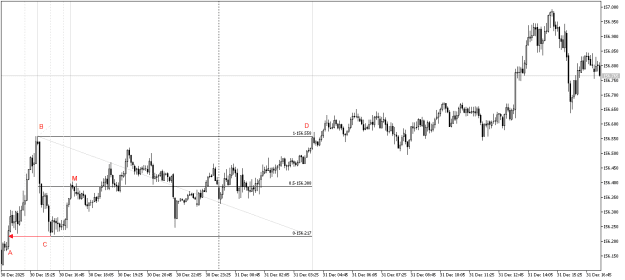
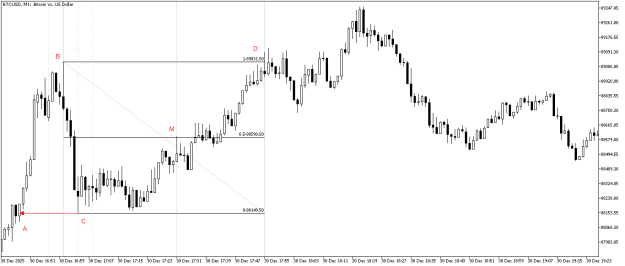
Updated on 14-05-2026 (By god grace its took me sometime how to draw the line on the chart by assuming Price=Time [or] Time=Price. Along with this, what we need to observe is Identifying the particular type of pattern also place an Important role to analyse the supply and demand in financial markets. Below is the visual model/pattern of ICS updated with specification)
Visual Model of ICS_from entry to exit (i.e. Parameter P to Q)
Attached Image (click to enlarge)
---------------------------------------------------------------------------------------------------------------------------------------------------------
Real Example of ICS_from entry to exit (i.e. Parameter P to Q)
Attached Image (click to enlarge)
NOTE: Bottom attached is the Excel file is CALCULATOR to find VOLUME, LOT SIZE, STOP OUT PRICE at 50% of DD download it if needed.
From the above real example how do we calculate VOLUME, LOT SIZE, STOP OUT PRICE at 50% of DD is explained below from the screen shot of Excel Calculator for General Understanding:
Attached Image (click to enlarge)
1. For any propfirm challenge we purchase, we generally know un variable inputs like
-Challenge Account size
-Maximum Draw Down (MDD)
-Daily Drawdown(DD)
-Volume of 1 Standard Lot
-Minimum Step size in Lot
-Value of M & R (it is to be fixed by Us to Manage the Risk)
The above inputs to be fixed one time in Excel Calculator file as you see from Screen shot of image or from Attached Excel Sheet
2. Only two variable inputs to be given by us i.e. Entry price & Target price whenever setup presents
For current setup of NZDUSD pair:
Entry price at D=0.58436USD, Target price level at A=0.58301USD
3. we get output parameters Like
VOLUME=9259.26NZD [or]
LOT SIZE=0.09NZD
STOP OUT PRICE required at 50% OF DD=0.85436USD
4. Make sure Check in Row 21 must display "OK" if "NOT OK" try to increase the "R" in Row 6 till we get "OK".
Note: Please feel free to share your thoughts from general discussion from the above current example if any..
---------------------------------------------------------------------------------------------------------------------------------------------------------
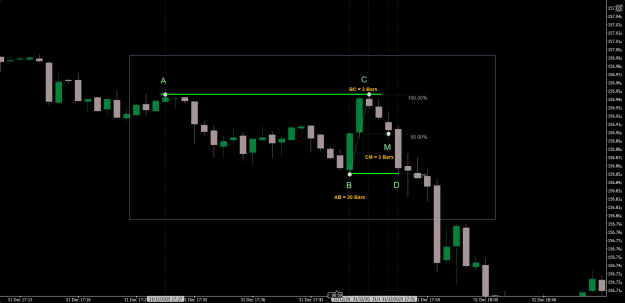
NOTE: Definition of Swing high & Swing Low
swing high: recent highest or equal high bar with either side bars as lower highs. (whenever equal high appear we chose recent equal high as swing high bar)
swing low: recent lowest or equal low bar with either side bars as higher lows. (whenever equal low appear we chose recent equal low as swing low bar)
actually it is simple 3bars swing i.e. one left (i+1) and one right side (i-1) to swing high bar(i) which is called as middle bar. (so total 3bars to qualify as swing)
Please see the Example of Swing High and Swing Low Identification from chart:
Attached Image (click to enlarge)
------------------------------------------
Thanks & Regards
NOTE1: It is Mechanically Rules Based ICS System. Kindly backtest on your own before take any Live Trades.
NOTE2: Real time forward examples from Post #99 onwards (updated on 16.04.2026)
(link for the post #99 : https://www.forexfactory.com/thread/...9#post15704499 )
NOTE3: Investor in the Gold be caution look at Post #83
(link for the post #83 : https://www.forexfactory.com/thread/...5#post15634065 )
Attached File(s)
KABIR IS ALMIGHTY GOD. RIGHT WAY OF WORSHIP=ROI, WRONG WAY OF WORSHIP=LOI