Another very interesting idea for lovers of SMART MONEY CONCEPTS:
The ICT indicator seeks to find FVG moments in two ways: The first is marking when it is found in the wick. The second is when it is found in the body of the candle.
This allows us to know in which regions of the candle smart money is being structured and shows us the structure being created in real time.
To implement, I also added an arrow signal for the breakout of these regions, which can provide an excellent opportunity to trade in the FOREX, FUTURES, CRYPTO, and DERIVATIVES markets.
For those interested, get in touch with me through Telegram CODE88BR.
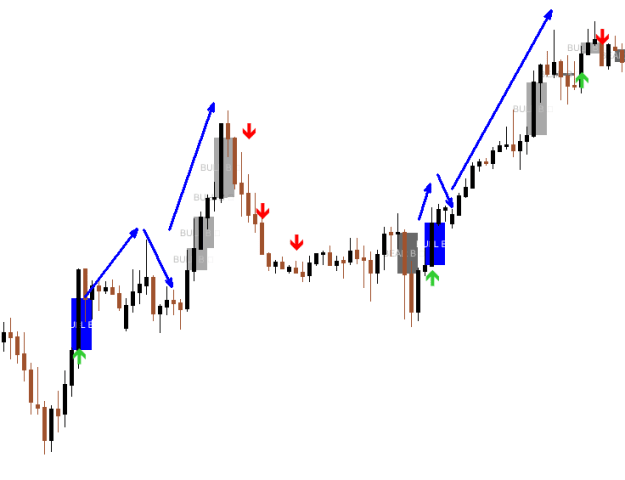
This indicator demonstrates stronger signals when the box is colored. For example: Observe the ICT box in a reddish-brown color in the image below. It is indicating that the sell signal is extremely strong.
Attached Image (click to enlarge)
Now observe this model when we obtain the box colored in blue: It is indicating that the buy signal is extremely strong.
Attached Image (click to enlarge)
It is very interesting how the movement is distributed most of the time in 3 waves, with the third wave being the largest of them all.