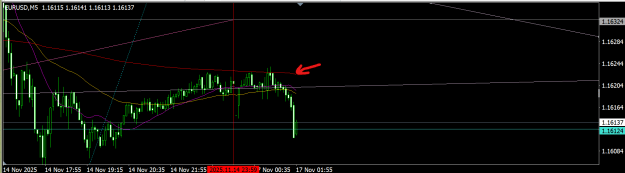
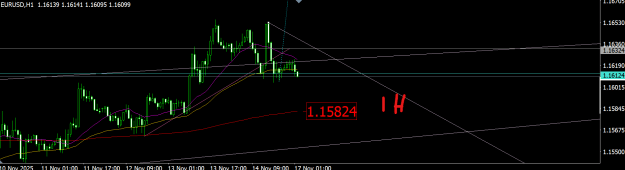
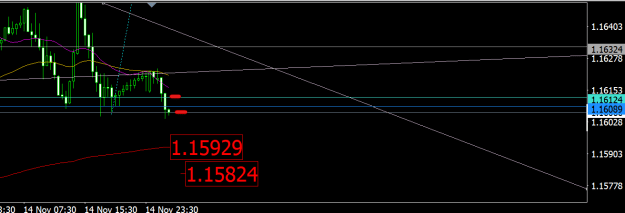
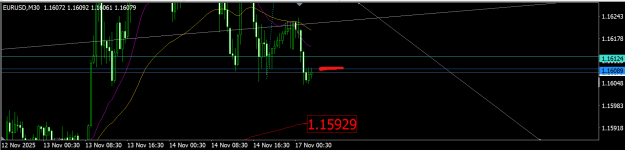
DislikedI got some bearish markers on those charts. I use them to see the bearish view even if I'm trading long. Those grey lines can go either way in direction. For instance the bull can fail structure not getting + 1632 and 1682 this close. But if it closes above those, along with other indications. It adds to it. It helps during those sideways periods. I know what it needs to do to continue with structure, or is failing to meet a mark. Those marks have timelines. On a normal day. Sustained above 1650 is a breakout to me. Some contradictions in trading...Ignored
Attached Image (click to enlarge)

those who can, do. those who cant, talk about those who can
1