The KDJ Indicator in MT5 is an enhanced version of the classic Stochastic Oscillator, built to offer deeper insight into market momentum and turning points. Available on MetaTrader 5, this indicator features three dynamic lines—K, D, and the uniquely responsive J line. The J line sharpens the indicator's sensitivity to market shifts, making it highly effective for identifying overbought and oversold conditions with greater precision. Whether you're trading forex, crypto, or stocks, the KDJ indicator delivers high-quality signals ideal for trend-based strategies.
 Why Use the KDJ Indicator on MT5?
 Identifies Overbought & Oversold Zones – Enhances accuracy in spotting trend reversals.
J Line Precision – Provides faster signals than traditional oscillators.
Works in Trending & Ranging Markets – Great for spotting momentum shifts.
Built for Intraday Traders – Perfect for short- to medium-term analysis.
You can download it from this link:
https://cdn.tradingfinder.com/file/2...tflab-v1-2.zip
You can also access the MetaTrader 4 version of this indicator through this page:
https://www.forexfactory.com/thread/...oad-free-tflab
For instructions on how to install:
https://www.forexfactory.com/thread/...-in-metatrader
 Indicator Overview
Category: Price Action - Strength - Oscillator
Platform: MetaTrader 5 (MT5)
Skill Level: Intermediate
Indicator Type: Trend Continuation - Reversal
Timeframe: Multi-Timeframe
Trading Style: Day Trading
Markets: Forex, Crypto, Stocks
 Understanding the KDJ Indicator
What Makes KDJ Unique?
 Based on the Stochastic Oscillator, but enhanced with a third line – J.
The J line highlights the divergence between K and D lines.
This provides quicker reactions to momentum shifts and potential reversals.
Key Market Functions
Spot oversold zones when J dips below K and D – bullish potential.
Spot overbought zones when J rises above K and D – bearish potential.
Combines well with price action levels and candle patterns.
 Example: Bullish Signal – GBP/USD – 4H Chart
J line crosses below K and D, then moves upward.
Indicates oversold condition → potential bullish reversal.
Confirm with bullish candles or support zone to enter Buy trade.
Visual: GBP/USD Bullish Reversal via KDJ
Example: Bearish Signal – AUD/USD – 1H Chart
J line crosses above K and D → overbought condition.
Signifies buyer exhaustion and potential trend reversal.
Combine with resistance zone or bearish pattern for Sell trade confirmation.
Visual: AUD/USD Bearish Reversal via KDJ
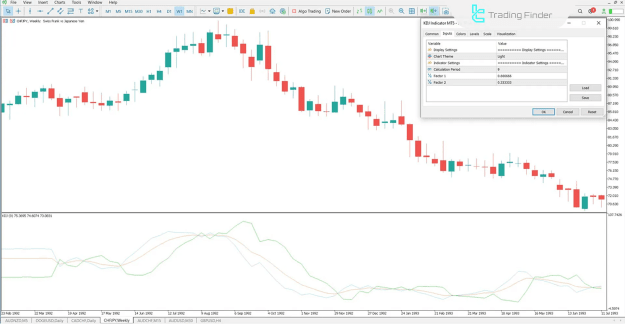
 Indicator Settings & Customization
Key Settings:
Chart Theme – Switch between light or dark display modes.
Period – Base period for calculation (default: 9).
Factor1 – First smoothing factor (default: 0.666666).
Factor2 – Second smoothing factor (default: 0.333333).
 Why Traders Choose the KDJ Indicator
Faster Signals than Traditional Oscillators – The J line offers early warnings.
Multi-Market Utility – Works well on Forex, Crypto, and Stock assets.
Easy to Integrate – Use with support/resistance or trend tools.
Ideal for Day Traders – Accurate across lower timeframes.
 Conclusion
The KDJ Indicator for MetaTrader 5 is a powerful tool for identifying overbought/oversold conditions and detecting trend reversals early. The J line’s rapid responsiveness provides a critical edge over the traditional Stochastic Oscillator, allowing traders to catch moves with greater precision and speed.
 Enhance your market timing with the KDJ Indicator on MT5 – start trading smarter today!
You can download it from this link:
https://cdn.tradingfinder.com/file/2...tflab-v1-2.zip
You can also access the MetaTrader 4 version of this indicator through this page:
https://www.forexfactory.com/thread/...oad-free-tflab
For instructions on how to install:
https://www.forexfactory.com/thread/...-in-metatrader
Inserted Video
Category: Price Action - Strength - Oscillator
Platform: MetaTrader 5 (MT5)
Skill Level: Intermediate
Indicator Type: Trend Continuation - Reversal
Timeframe: Multi-Timeframe
Trading Style: Day Trading
Markets: Forex, Crypto, Stocks
The KDJ Indicator for MetaTrader 5 is a powerful tool for identifying overbought/oversold conditions and detecting trend reversals early. The J line’s rapid responsiveness provides a critical edge over the traditional Stochastic Oscillator, allowing traders to catch moves with greater precision and speed.
Attached Image(s) (click to enlarge)