Understanding the Inverse Fair Value Gap (IFVG) in Trading
The Inverse Fair Value Gap (IFVG) is a market structure concept used to identify areas of significant price displacement that may signal a shift in market sentiment. Unlike standard Fair Value Gaps (FVGs), which often act as magnets for price to revisit, IFVGs highlight zones where price may be less likely to return—suggesting the possibility of a strong directional move or trend reversal. Understanding IFVGs may offer traders additional conext when analysing momentum-driven markets or planning entries and exits. This article examines how IFVGs form, how they differ from conventional FVGs, and how they might be incorporated into a broader technical analysis framework.
Fair Value Gaps (FVGs) – A Brief Overview
A Fair Value Gap (FVG) occurs when the market moves so rapidly in one direction that it leaves an imbalance in price action. This imbalance shows up on a chart as a gap between three consecutive candles: the wick of the first candle and the wick of the third candle fail to overlap, leaving a “gap” created by the second candle. It essentially highlights an area where buying or selling pressure was so dominant that the market didn’t trade efficiently.
Traders view these gaps as areas of potential interest because markets often revisit these levels to "fill" the imbalance. For example, in a bullish FVG, the gap reflects aggressive buying that outpaced selling, potentially creating a future support zone. On the other hand, bearish FVGs indicate overwhelming selling pressure, which might act as resistance later.
TO VIEW THE FULL ANALYSIS, VISIT FXOPEN BLOG
Disclaimer: This article represents the opinion of the Companies operating under the FXOpen brand only (excluding FXOpen EU). It is not to be construed as an offer, solicitation, or recommendation with respect to products and services provided by the Companies operating under the FXOpen brand, nor is it to be considered financial advice.
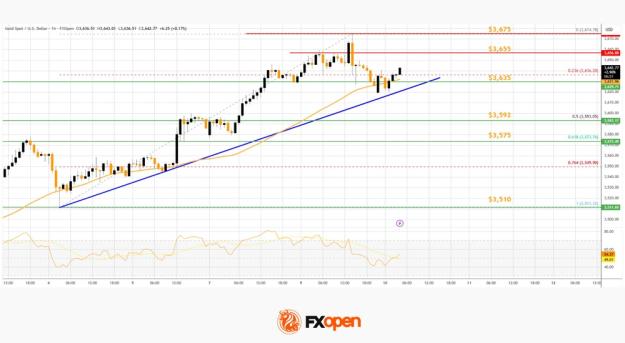
Attached Image (click to enlarge)
The Inverse Fair Value Gap (IFVG) is a market structure concept used to identify areas of significant price displacement that may signal a shift in market sentiment. Unlike standard Fair Value Gaps (FVGs), which often act as magnets for price to revisit, IFVGs highlight zones where price may be less likely to return—suggesting the possibility of a strong directional move or trend reversal. Understanding IFVGs may offer traders additional conext when analysing momentum-driven markets or planning entries and exits. This article examines how IFVGs form, how they differ from conventional FVGs, and how they might be incorporated into a broader technical analysis framework.
Fair Value Gaps (FVGs) – A Brief Overview
A Fair Value Gap (FVG) occurs when the market moves so rapidly in one direction that it leaves an imbalance in price action. This imbalance shows up on a chart as a gap between three consecutive candles: the wick of the first candle and the wick of the third candle fail to overlap, leaving a “gap” created by the second candle. It essentially highlights an area where buying or selling pressure was so dominant that the market didn’t trade efficiently.
Traders view these gaps as areas of potential interest because markets often revisit these levels to "fill" the imbalance. For example, in a bullish FVG, the gap reflects aggressive buying that outpaced selling, potentially creating a future support zone. On the other hand, bearish FVGs indicate overwhelming selling pressure, which might act as resistance later.
TO VIEW THE FULL ANALYSIS, VISIT FXOPEN BLOG
Disclaimer: This article represents the opinion of the Companies operating under the FXOpen brand only (excluding FXOpen EU). It is not to be construed as an offer, solicitation, or recommendation with respect to products and services provided by the Companies operating under the FXOpen brand, nor is it to be considered financial advice.
FXOpen - International True ECN Broker