The II_SupDem indicator (originally developed by bredin, if I recall correctly) uses the zigzag formula to plot supply and demand zones on your chart for the current timeframe. Attached is an enhancement that plots these zones on whatever TFs (M1,M5,M15,M30,H1,H4,D1,W1 and/or MN) you specify in the TimeFrames parameter setting, on the RHE of your main chart. If you want the TF descriptions displayed, as shown in the screenshot, set the ShowTFDescriptions parameter setting to true, and then press F8, go to the Common tab and check 'Show object descriptions' ON.


I haven't posted the .mq4 file because the indicator was written using MQL4 build 509, and will therefore likely compile with a zillion errors.
Also, this is for MT4 only. I don't have any experience coding MQL5.
Here is a version of bredin's (single timeframe) II_SupDem indicator:
For more info, try Googling (or ask an AI like ChatGPT) "how to use supply and demand zones"
Disclaimer: I'm NOT necessarily claiming that these techniques can be used profitably. Develop the ideas further if/however you wish, and use at your own risk. 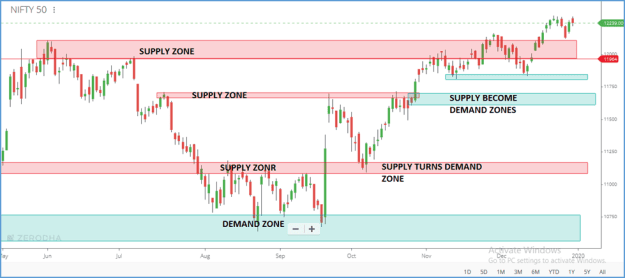
Attached Image (click to enlarge)
Attached Image (click to enlarge)
I haven't posted the .mq4 file because the indicator was written using MQL4 build 509, and will therefore likely compile with a zillion errors.
Also, this is for MT4 only. I don't have any experience coding MQL5.
Attached File(s)
Here is a version of bredin's (single timeframe) II_SupDem indicator:
Attached File(s)
For more info, try Googling (or ask an AI like ChatGPT) "how to use supply and demand zones"
Disclaimer: I'm NOT necessarily claiming that these techniques can be used profitably. Develop the ideas further if/however you wish, and use at your own risk.
Attached Image (click to enlarge)