{quote} Here is an indicator that will draw Horizontal line with price & TF tag with button. Only one problem with "Delete All Objects" code if someone can fix. {file}
Ignored
bro you created nice too all OK i appreciate it. is it possible just click button and horizontal price tag open and i can click and drag any place of chart to show price /tag.thanks
{quote} BEFORE: The loop that iterates over all bars (using Bars) on every call, redundantly recalculating and assigning volumes via repeated slow iVolume function calls, instead of limiting updates to new or changed bars with prev_calculated and directly using the provided volume[] array. --- AFTER:Correct OnCalculate function: int OnCalculate(const int rates_total, const int prev_calculated, const datetime &time[], const double &open[], const double &high[], const double &low[], const double &close[], const long &tick_volume[], const long &volume[],...
Ignored
What you say is true, but that's not an error which would prvent the indicator from working!
It's just that the indicator will not work efficiently.
The problem is this:
Attached Image (click to enlarge)
If he wants to see volumes in the chart window, he needs to convert them to the prices on the chart.
.ex4/.ex5 files can't be fixed or modified / I'm not a coder!
{quote} in this case it's better to use a script (scripts folder). You just drag&drop the script onto a chosen candle. {file} {image} the acd indicator is not good for your purpose.
Ignored
any master coder please add price tag/label and create one scripts for open close.thanks
{quote} average_price_between_2vlines - draggable lines with an average price text - optional prices to use for averaging: Bodies, full candles, opens, highs, lows, closes {file} {image}
Ignored
bro is it possible show high -low price same way .i mean if i draw rectangle/box and move up down than price /label show high-low and middle ( HIGH-LOW MILE LINE STYLE THICK/SOLID .DOT .thanks
{quote} BEFORE: The loop that iterates over all bars (using Bars) on every call, redundantly recalculating and assigning volumes via repeated slow iVolume function calls, instead of limiting updates to new or changed bars with prev_calculated and directly using the provided volume[] array. --- AFTER:Correct OnCalculate function: int OnCalculate(const int rates_total, const int prev_calculated, const datetime &time[], const double &open[], const double &high[], const double &low[], const double &close[], const long &tick_volume[], const long &volume[],...
Ignored
Funny thing!
Using volumes[] returns array out of range, consistently!!!
And even when we get rid of the error, there is no plot...
Looks like this is some new build update, and we now need to use tick_volume[]!
{quote} Should have mentioned the different price settings with same lengths in the first post. At first glance of your pic the concern is overlapping colors cancelling eachother out, I'm not going to inspect the picture to figure out what settings you're using, having a ma crossover on both high and low is not a common thing. MA_ribbon - v1.2 {image} {file}
Ignored
Please can you add alert to the crossover i love your ribbon. Thanks
Apologise for the oversight this morning, but here is the OvO version and the EA is still taking trades in the opposite direction.
Thanks for checking this out. Hercs.
Apologise for the oversight this morning, but here is the OvO version and the EA is still taking trades in the opposite direction. Thanks for checking this out. Hercs. {image}
Ignored
How can we tell from your image that the EA is actually taking trades in the opposite direction?
Does your EA have any conditions based on the Renko Bar color (direction)?
And, if you don't overlay the indicator line, how can we tell that the direction of the line when the trade was taken wasn't the correct one?
No to mention the fact that the line can easily redraw, especially when the brick is relatively small.
So you would need to observe in real time.
And also, what is the brick size in the inputs???
And what are the indicator parameters???
Too many questions, too many variables to consider.
The EA only does what the code tells it to do.
If the coder didn't predict something, the EA isn't intelligent and can't execute what hasn't been coded.
.ex4/.ex5 files can't be fixed or modified / I'm not a coder!
{quote} bro you created nice too all OK i appreciate it. is it possible just click button and horizontal price tag open and i can click and drag any place of chart to show price /tag.thanks
Ignored
It's not my indicator, I just found one for you that you could possibly use.
{quote} How can we tell from your image that the EA is actually taking trades in the opposite direction? Does your EA have any conditions based on the Renko Bar color (direction)? And, if you don't overlay the indicator line, how can we tell that the direction of the line when the trade was taken wasn't the correct one? No to mention the fact that the line can easily redraw, especially when the brick is relatively small. So you would need to observe in real time. And also, what is the brick size in the inputs??? And what are the indicator parameters???...
Ignored
This is a better screenshot.
Secondly, I have placed screenshots marking the entries with incorrect entries, but I am sure you did not see that from what you're asking here.
Finally, the EA max spread is 35,000 because I am working in ICMarkets which is a 5 digit platform. The spread is 120.0 but easily reaches 35,000.
The Bricksize = 10,000 which you can see in the bottom left corner of the screenshot. The Followline indicator is set to "Single Arrows" as signal mode. Attaching the indicator for your perusal and comments.
Looking forward to hearing from you sometime tomorrow at your convenience.
Hercs.
{quote} This is a better screenshot. Secondly, I have placed screenshots marking the entries with incorrect entries, but I am sure you did not see that from what you're asking here. Finally, the EA max spread is 35,000 because I am working in ICMarkets which is a 5 digit platform. The spread is 120.0 but easily reaches 35,000. The Bricksize = 10,000 which you can see in the bottom left corner of the screenshot. The Followline indicator is set to "Single Arrows" as signal mode. Attaching the indicator for your perusal and comments. Looking forward...
Ignored
In the previous image the Brick is 2,000.
And I did see those trade arrows, but I didn't see the indicator arrows and lines when those trades were taken.
But I don't see those trade arrows on the present image.
It's pointless to show me the historical picture.
It's also pointless to demand that an EA will place trades where you think they should be placed!
Especially when you didn't see the reality there and then.
Also, there is more conflicting information on your images.
Like the Renko chart is M61, and you have a second OVO Renko creator on that chart which generates a chart labeled M62...
I am sorry, but you are providing contradictory information.
I can't work with that!
https://www.forexfactory.com/attachm...6?d=1503245785 in this page i upload master candle.. which take master candle with n number of following candles.. can any one change this to master candle to previous n number of candles.... will be helpful
Ignored
Inserted Code
//+------------------------------------------------------------------+
//|                                                Master_Candle.mq4 |
//|                                     SanMiguel, Forex4Noobs forum |
//|                                                                  |
//+------------------------------------------------------------------+
#property copyright ""
#property link      ""
#property indicator_chart_window
extern int MinEngulfCandles = 1;
extern color TopLineColor = clrMediumVioletRed;
extern color BottomLineColor = clrMediumVioletRed;
extern color SizeColor = clrGold;
extern double TextGap = 0.0000;
extern string TextSize = 10;
extern int LineWidth = 2;
extern bool WaitForCandleClose = false;
extern bool IgnoreWick = false;
extern bool SoundAlert = false;
int IndexOffset = 0, PipFact = 1;
datetime LastAlertTime;
//+------------------------------------------------------------------+
//| Custom indicator initialization function                         |
//+------------------------------------------------------------------+
int init()
{
   if (WaitForCandleClose)
   {
      IndexOffset = 0;
   }
   else
   {
      IndexOffset = 1;
   }

   if(Digits == 3 || Digits == 5)
     PipFact = 10;
//----
   return(0);
}
//+------------------------------------------------------------------+
//| Custom indicator deinitialization function                       |
//+------------------------------------------------------------------+
int deinit()
{
//----
   int    obj_total=ObjectsTotal();
   string name, topLine, bottomLine, Name2;
   topLine = Symbol()+"_"+Period()+"_MasterTop_";
   bottomLine = Symbol()+"_"+Period()+"_MasterBottom_";
   Name2 = Symbol()+"_2_"+Period()+"_MasterTop_";
   for(int i=obj_total-1; i>=0; i--)
   {
      name=ObjectName(i);
      if (StringFind(name,topLine,0) != -1 || StringFind(name,bottomLine,0) != -1 || StringFind(name,Name2,0) != -1)
      {
         ObjectDelete(name);
      }
   }
//----
   return(0);
}
//+------------------------------------------------------------------+
//| Custom indicator iteration function                              |
//+------------------------------------------------------------------+
int start()
{
   int i;                           // Bar index
   int Counted_bars;                // Number of counted bars
   //--------------------------------------------------------------------
   Counted_bars=IndicatorCounted(); // Number of counted bars
   i=Bars-Counted_bars-1;           // Index of the first uncounted

   // always recount the latest possible location for a master candle to be formed
   if (i == 0)
   {
      i = MinEngulfCandles+1;  // here 4 +1 =5 agum
   }
   while (i>MinEngulfCandles-IndexOffset) //  && (MinEngulfCandles+IndexOffset < i) ) // Loop for uncounted bars
    {
      if (isMasterCandle(i))
      {
         DrawLines(i);
         if (i == MinEngulfCandles-IndexOffset+1)
         {
            if (SoundAlert && LastAlertTime < Time[0])
            {
               Alert("Master Candle detected on "+Symbol()+" at candle: "+TimeToStr(Time[i],TIME_DATE|TIME_MINUTES));
               LastAlertTime = Time[0];
            }
         }
      }
      else
      {
         DeleteLines(i);
      }
      i--;
   }
//----
   return(0);
}
bool isMasterCandle(int index)
{
   double CandleTop = High[index];
   double CandleBottom = Low[index];

   for (int h = index-1; h >= index - MinEngulfCandles; h--)
   {
      if (IgnoreWick)
      {
         if (Close[h] >= Open[h]) // bull or doji candle
         {
            if (Close[h] > CandleTop || Open[h] < CandleBottom)
            {
               return (false);
            }
         }
         if (Close[h] <= Open[h]) // bear or doji candle
         {
            if (Open[h] > CandleTop || Close[h] < CandleBottom)
            {
               return (false);
            }
         }
      }
      else
      {
         if (High[h] > CandleTop || Low[h] < CandleBottom)
         {
            return (false);
         }
      }
   }

   return (true);
}
void DrawLines(int index)
{
   string TopName = Symbol()+"_"+Period()+"_MasterTop_" + Time[index];
   ObjectCreate(TopName, OBJ_TREND, 0, Time[index], High[index], Time[index - MinEngulfCandles], High[index]);
   ObjectSet(TopName, OBJPROP_RAY, false);
   ObjectSet(TopName, OBJPROP_WIDTH, LineWidth);
   ObjectSet(TopName, OBJPROP_COLOR, TopLineColor);

   string BottomName = Symbol()+"_"+Period()+"_MasterBottom_" + Time[index];
   ObjectCreate(BottomName, OBJ_TREND, 0, Time[index], Low[index], Time[index - MinEngulfCandles], Low[index]);
   ObjectSet(BottomName, OBJPROP_RAY, false);
   ObjectSet(BottomName, OBJPROP_WIDTH, LineWidth);
   ObjectSet(BottomName, OBJPROP_COLOR, BottomLineColor);

   string TopName2 = Symbol()+"_2_"+Period()+"_MasterTop_" + Time[index];
   ObjectCreate(TopName2, OBJ_TEXT, 0, Time[index], High[index] + TextGap, 0 ,0);
   ObjectSet(TopName2, OBJPROP_ANCHOR, ANCHOR_LEFT_LOWER);
   ObjectSetText(TopName2, DoubleToStr((High[index] - Low[index]), 2), TextSize, "Century Gothic", SizeColor);
}
void DeleteLines(int index)
{
   string TopName = Symbol()+"_"+Period()+"_MasterTop_" + Time[index];
   string BottomName = Symbol()+"_"+Period()+"_MasterBottom_" + Time[index];
   if (ObjectFind(TopName) == 0 || ObjectFind(BottomName) == 0) // found in main chart window
   {
      ObjectDelete(TopName);
      ObjectDelete(BottomName);
      if (SoundAlert)
      {
         Alert("Master Candle REMOVED on "+Symbol()+" at candle: "+TimeToStr(Time[index],TIME_DATE|TIME_MINUTES));
      }
   }
}
//+------------------------------------------------------------------+
/*
 for ( (int h = index-1; h >= index - MinEngulfCandles; h--)
      {
        (int k = index+ MinEngulfCandles ; k <= index - MinEngulfCandles; k--) )
         {
           if (IgnoreWick)
           {
              if ( (Close[h] >= Open[h]) &&       // bull or doji candle
                   (Close[k] >= Open[k]) )
             {
                if( (Close[h] > CandleTop || Open[h] < CandleBottom) &&
                    (Close[k] > CandleTop || Open[k] < CandleBottom) )
                {
                  return (false);
                  }
             }
             if ( (Close[h] <= Open[h]) &&       // bear or doji candle
              (Close[k] <= Open[k]) )
              {
                 if ( (Open[h] > CandleTop || Close[h] < CandleBottom)  &&
                      (Open[k] > CandleTop || Close[k] < CandleBottom))
                {
                   return (false);
                }
              }
          }
      else
      {
         if( (High[h] > CandleTop || Low[h] < CandleBottom) &&
            (High[k] > CandleTop || Low[k] < CandleBottom))
           {
            return (false);
           }
       }
    }
 }
   return (true);
}
*/
i changed the greater than symbol to lesser than but it is not shown anything ... any one help will be appreciated...
Attached Image(s) (click to enlarge)
Success is a Journey Not a Destination....... kind regards ramzam
{quote} This is a better screenshot. Secondly, I have placed screenshots marking the entries with incorrect entries, but I am sure you did not see that from what you're asking here. Finally, the EA max spread is 35,000 because I am working in ICMarkets which is a 5 digit platform. The spread is 120.0 but easily reaches 35,000. The Bricksize = 10,000 which you can see in the bottom left corner of the screenshot. The Followline indicator is set to "Single Arrows" as signal mode. Attaching the indicator for your perusal and comments. Looking forward...
Ignored
Following from yesterday,
The EA has a lot of issues.
One issue has been recognized and solved.
What will come up, I don't know, yet.
The indicator also had a serious issue when working on a Renko chart.
This issue also seems to be solved, now.
TBC
.ex4/.ex5 files can't be fixed or modified / I'm not a coder!
Glad I saw the MT5 version of the Bigger TF OHLC indicator and good thing that it already has the uniqueID in the code. I tested it in MT5 platform and it works great but I noticed that the lines are disappearing when changing timeframes. May I ask for your help to fix it? Im actually going to settled with the MT4 ver. but my broker is planning to transition to MT5 so I humbly ask for your assistance again for the last time.
Need a good symbol and timeframe changer for MT4? Here you go!
WM4X-ChartChanger
indicator
Features:
- Openable / Foldable (switch between them by pressing the main/central button)
- Movable (click/release > move > click/release in the header)
- Resizable
- Selectable instrument list (All instruments / Market Watch instruments / Custom instrument list)
- Direct selection by symbol and/or TF / Arrow navigation
- Custom color selection
- Screenshot with custom watermark (pictures are saved into the {Data Folder}/Files/ScreenShots folder)
- Close button for convenient and quick removal
*** FREE to use. No limitation, no expiry date.
*** Do not rename the program, otherwise it will not work.
*** Recommended monospace font for optimized/best looking: Source Code Pro (download link >> https://fonts.google.com/specimen/Source+Code+Pro)
Animated GIF image, click on it to see it in action:
{quote} This is a better screenshot. Secondly, I have placed screenshots marking the entries with incorrect entries, but I am sure you did not see that from what you're asking here. Finally, the EA max spread is 35,000 because I am working in ICMarkets which is a 5 digit platform. The spread is 120.0 but easily reaches 35,000. The Bricksize = 10,000 which you can see in the bottom left corner of the screenshot. The Followline indicator is set to "Single Arrows" as signal mode. Attaching the indicator for your perusal and comments. Looking forward...
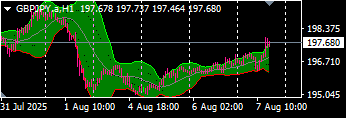
Added "ifTrade" input parameter.
When false, the EA will not take any trades.
Instead, it will plot an entry arrow, blue for Buy, red for Sell.
Added "defSpreadForTesting" input parameter.
This works only for ifTrade = false.
The Sell arrow will be plotted at Bid.
The Buy arrow will be plotted at Bid + defSpreadForTesting.
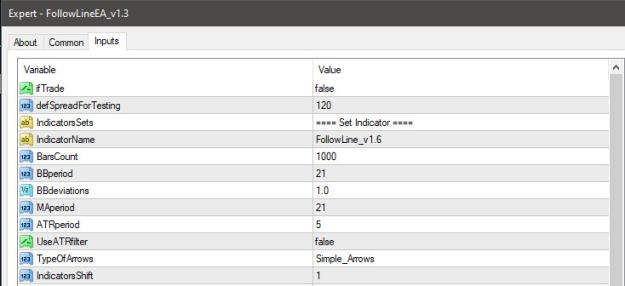
When ifTrade = false, the input parameters in the above image can be manipulated.
All the rest input parameters are not taken into account in this mode.
There will be some debugging messages printed in the logs.
There will be the ok sound when conditions for a trade arrow appear.
Issues solved:
1. zero divide issue,
2. improved lotsize calculations,
3. wrong direction trades,
4. other minor issues.
Elements not tested:
All other EA functions like: TP, SL, TS, time, etc. have not been checked.
The indicator has been improved for proper functionality on Renko charts.
NOTE!!!
I noticed that the indicator arrow can repaint on the first closed bar.
The EA is coded in such a way that the trade can only be taken on the first tick of the new bar.
This means that if the signal arrow wasn't there on the first tick, the trade will not be executed.
Also, if for any reason on the broker's side the order isn't filled, there will not be any position.
.ex4/.ex5 files can't be fixed or modified / I'm not a coder!