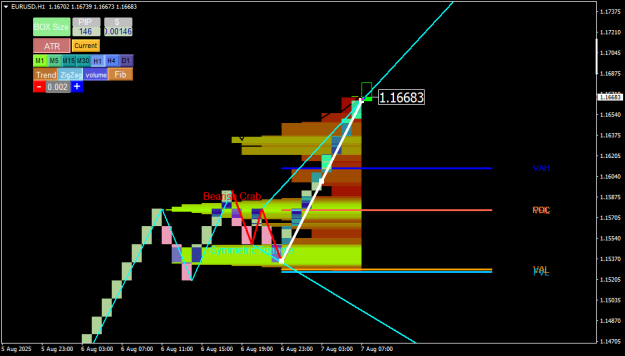
This is a multi-layered technical breakdown of the EUR/USD pair on the 1-hour chart, incorporating harmonic patterns, volume profile levels, and classic price action tools.
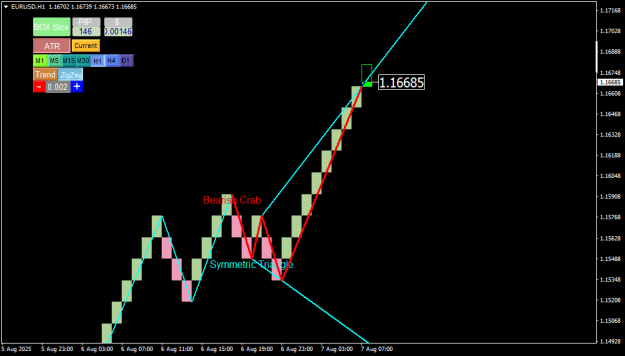
- Bearish Crab Pattern: A harmonic reversal setup suggesting potential downside from the PRZ (Potential Reversal Zone). Price has reacted to this zone, indicating possible bearish momentum.
- Symmetrical Triangle Formation: Price is consolidating within a triangle, hinting at an imminent breakout. Watch closely for a decisive move above or below the triangle boundaries.
![]() Volume Profile Levels
Volume Profile Levels
- VAH (Value Area High): Acts as a resistance zone where price previously stalled.
- POC (Point of Control): The most traded price level within the range, often a magnet for price and a key decision point.
- VAL (Value Area Low): Serves as a support zone; a break below could accelerate bearish pressure.
![]() Additional Indicators & Tools
Additional Indicators & Tools
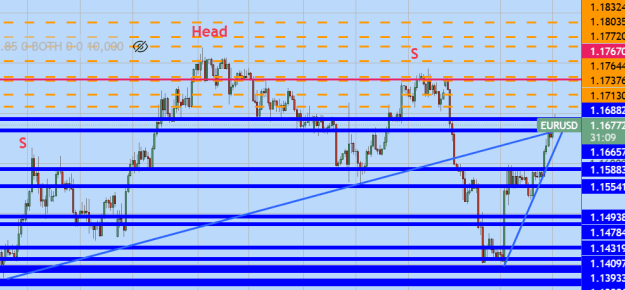
- Trendlines & Zigzag Structure: Highlighting the current market rhythm and swing points.
- Fibonacci Retracements: Used to identify key retracement levels and potential targets.
- ATR & Pip Range: Measuring volatility and average price movement to assess risk/reward.
- Timeframe: Analysis covers August 5–7, 2025, focusing on short-term price action.
![]() Summary & Outlook
Summary & Outlook
The confluence of a bearish harmonic pattern and a symmetrical triangle suggests a breakout scenario. A downside break would align with the Bearish Crab setup, targeting lower volume areas. However, a bullish breakout above VAH could invalidate the bearish bias and trigger a trend reversal.
![]() Trading Tip: Wait for confirmation of the breakout direction before entering. Volume and momentum indicators can help validate the move.
Trading Tip: Wait for confirmation of the breakout direction before entering. Volume and momentum indicators can help validate the move.
Let me know if you'd like a version with chart annotations or a follow-up post with trade setups!
![]() Buy Scenario (Bullish Breakout)
Buy Scenario (Bullish Breakout)
Conditions for Entry:
- Price breaks above the Symmetrical Triangle with strong bullish candle close.
- Volume confirms breakout (preferably above VAH and POC).
- Bearish Crab pattern is invalidated (price moves beyond PRZ).
Entry Point:
- Above VAH or triangle resistance (~1.0950 area, depending on exact chart).
Stop Loss:
- Below breakout candle or below triangle support (~1.0910–1.0920).
Take Profit Targets:
- TP1: Recent swing high (~1.0980)
- TP2: Fibonacci extension 1.618 (~1.1010)
- TP3: Psychological level (~1.1050)
Risk/Reward Ratio:
- Minimum 1:2 recommended
![]() Sell Scenario (Bearish Breakdown)
Sell Scenario (Bearish Breakdown)
Conditions for Entry:
- Price breaks below the triangle support and confirms rejection from PRZ of Bearish Crab.
- Volume supports bearish move (price below POC and VAL).
Entry Point:
- Below VAL or triangle support (~1.0910 area)
Stop Loss:
- Above breakout candle or above triangle resistance (~1.0940–1.0950)
Take Profit Targets:
- TP1: Previous low (~1.0880)
- TP2: Fibonacci retracement 61.8% (~1.0850)
- TP3: Extended support zone (~1.0820)
Risk/Reward Ratio:
- Minimum 1:2 recommended
![]() Risk Management Tips
Risk Management Tips
- Avoid trading inside the triangle (low conviction zone).
- Use ATR to size stop loss appropriately.
- Wait for candle close confirmation to avoid false breakouts.