These price points represent areas where market participants have historically reacted, making them valuable for identifying potential reversals or breakouts.
https://cdn.tradingfinder.com/file/4...5-by-tflab.zip
https://www.forexfactory.com/thread/...cator-mt4-free
https://www.forexfactory.com/thread/...-in-metatrader
Prop Firm DrawDown Protector : Prop Firm Capital Protection Expert MT5 | Forex Money Management: Forex Trade Management Expert MT5 | ICT Concepts Indicator MT5 |Smart Money Concepts Expert MT5 |Get a free Expert Advisor license via Telegram and WhatsApp
Key Features
- Platform Compatibility: MetaTrader 5 (MT5)
- Trading Skill Level: Intermediate
- Indicator Categories:
- Support & Resistance
- Breakout
- Reversal
- Multi-Timeframe
- Trading Assist
- Trading Instruments:
- Forex
- Cryptocurrencies
- Stocks
- Trading Style: Intraday and short-term analysis
How the Indicator Works
The Previous Highs and Lows indicator marks historical high and low levels as horizontal lines based on past market performance. These zones become reactive areas where the price might:
- Reverse its current trend
- Break through and continue trending in the same direction
- Consolidate before resuming a move
These reactions provide trading signals for both entry and exit points, depending on the prevailing market structure and confirmation through volume or candlestick patterns.
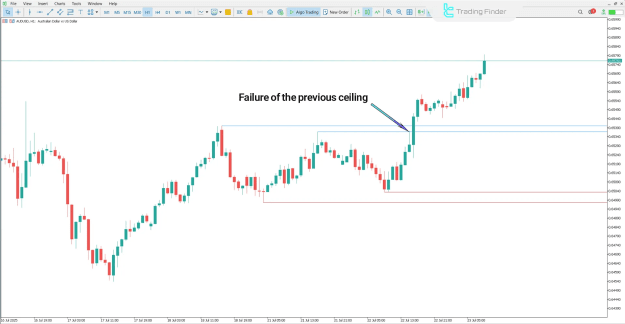
Bullish Trend Example
In an uptrend, a break above the previous high is typically interpreted as a sign of strength in the bullish structure. For example, on the AUD/USD 1-hour chart, the price breaks above a key resistance (indicated by a blue line), confirming bullish momentum.
- Following the breakout, the market often pulls back to retest the broken high.
- If the level holds, it becomes support, offering a favorable buy entry.
- The rejection from this level signifies continued buying pressure.
Bearish Trend Example
In a downtrend, price action below a previous low confirms ongoing weakness. On the EUR/NZD 5-minute chart:
- A break beneath the previous low confirms bearish sentiment.
- A return to this level, which then acts as resistance, offers a valid sell setup.
- Candle rejections and long upper wicks further support the continuation of the downtrend.
Indicator Settings Panel in MT5
Users can customize the visual and functional aspects of the indicator within MetaTrader 5. The configuration includes:
- DRAW PIVOTS: Enable/disable pivot level display
- ZIGZAG PERIOD: Adjust the Zigzag pattern sensitivity
- ZIGZAG BACKSTEP: Define minimum distance between Zigzag pivot points
- DISPLAY ZIGZAG: Show Zigzag structure on the chart
- DISPLAY PIVOT LABELS: Toggle visibility of level labels
- HIGH LINE COLOR / LOW LINE COLOR: Customize color for high and low levels
- LINE WIDTH: Modify the thickness of horizontal lines
- PREFIX: Add custom prefixes to level labels
- HISTORY LIMIT: Set the number of past candles for analysis
Conclusion
The Previous Highs and Lows indicator for MetaTrader 5 is a technical tool tailored for traders seeking to identify significant historical price levels. By marking these reactive zones, the indicator enhances the trader’s ability to detect support and resistance, validate breakouts, and recognize high-probability trade entries in both trending and ranging markets.
This indicator is especially useful in intraday trading strategies, where precise level identification is crucial for managing risk and improving accuracy.