Hi TooSlow,
Thank you very much for the wonderful strategy and I was hanging around reading and now I finally took the plunge.
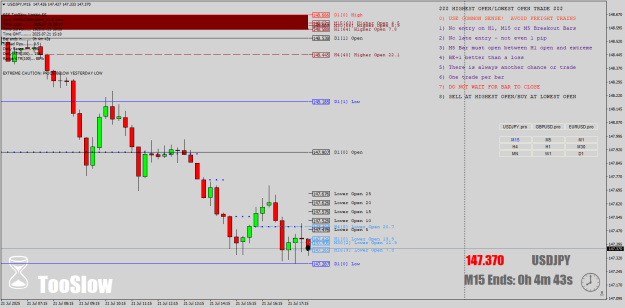
I have started the challenge with USDJPY. I have some winners and some losers on the same day. I hope that with advice from experienced traders I am able gain competency with HOLO method. After starting the challenge, I realized that by just looking at the H1 bars, it seems so obviously easy, but during a live session when we drill down to the raw ticks things get more interesting and confusing.
The common scenario I entered was:
Let say at the HO, prices don't just go up and then reverse down to hit HO for me to open a trade. Instead many times price moves up and down around HO. The M5 bars are opening above and below HO, alternating, making it difficult for me to decide to enter a SELL trade or not. My solution for now is: the price must extend at least some pips, say 6 pips above HO then I would consider entering SELL trade when the price comes back down to hit HO price. And I also need to be mindful of the bid-ask spread and prices shown on the live price chart
Would anyone have any feedback about what I am doing. Anyone with other experience to share are all welcome.
Is there back test or replay software/service that will replay historical data tick by tick? Perhaps creating a more realistic real time price action. With that kind of software I believe it could quicken my learning.
Cheers
Thank you very much for the wonderful strategy and I was hanging around reading and now I finally took the plunge.
I have started the challenge with USDJPY. I have some winners and some losers on the same day. I hope that with advice from experienced traders I am able gain competency with HOLO method. After starting the challenge, I realized that by just looking at the H1 bars, it seems so obviously easy, but during a live session when we drill down to the raw ticks things get more interesting and confusing.
The common scenario I entered was:
Let say at the HO, prices don't just go up and then reverse down to hit HO for me to open a trade. Instead many times price moves up and down around HO. The M5 bars are opening above and below HO, alternating, making it difficult for me to decide to enter a SELL trade or not. My solution for now is: the price must extend at least some pips, say 6 pips above HO then I would consider entering SELL trade when the price comes back down to hit HO price. And I also need to be mindful of the bid-ask spread and prices shown on the live price chart
Would anyone have any feedback about what I am doing. Anyone with other experience to share are all welcome.
Is there back test or replay software/service that will replay historical data tick by tick? Perhaps creating a more realistic real time price action. With that kind of software I believe it could quicken my learning.
Cheers