{quote} Hello , How can i add this code to my chart , Pls explain i will thank full to you for ever
Ignored
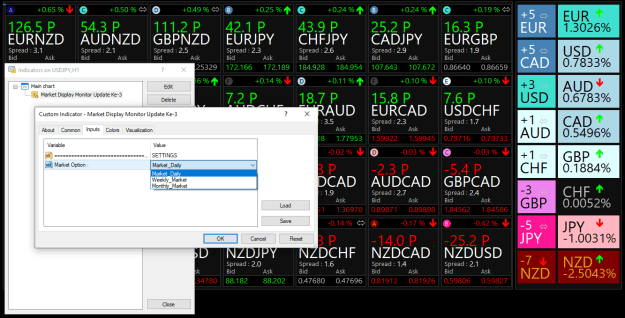
Just copy and paste it into the expert folder and attach it to the chart. But don't forget, this tool requires 28 pairs for data calculation, so be sure to download the historical data for these 28 pairs first.
I know that the more I know, the more I don't know
My current notes:
What is your trading strategy [Overbought/Oversold]? The appropriate grade is A, B. The logical reason is that the price is already too high, making it safer with less risk.
What is your trading strategy [Following the Trend Direction]? The appropriate grade is E, D. The logical reason is that the price is not yet too high, just enough to make a profit.
{image} My current notes: What is your trading strategy [Overbought/Oversold]? The appropriate grade is A, B. The logical reason is that the price is already too high, making it safer with less risk. What is your trading strategy [Following the Trend Direction]? The appropriate grade is E, D. The logical reason is that the price is not yet too high, just enough to make a profit. Salam Indo Zorox {file}
Ignored
Dear Zorox
Heat map from TF Day or Week or Month??
best regards
MR. ZOROX.
First of all, thank you very much for sharing your strategy with us. I wanted to make a suggestion, if you would be kind enough. It would be possible to color the letters A or B red, a warning of possible danger reaching the ceiling. And E or D could be the green box, a possible channel where the trend is still flowing. It would make for a more intuitive map, if you think it's appropriate.
THANK YOU VERY MUCH.
MR. ZOROX. First of all, thank you very much for sharing your strategy with us. I wanted to make a suggestion, if you would be kind enough. It would be possible to color the letters A or B red, a warning of possible danger reaching the ceiling. And E or D could be the green box, a possible channel where the trend is still flowing. It would make for a more intuitive map, if you think it's appropriate. THANK YOU VERY MUCH.
Ignored
Very dangerous, my friend. The Market Display Monitor only displays market conditions. It cannot be considered an entry signal. Colors and numbers will change quickly.
I know that the more I know, the more I don't know
Market Display Monitor is a tool for observing market price movements. Sometimes, traders, whether they have already made a transaction or not, will briefly observe the currency they're targeting to determine its potential and risk. Some people simply need a visual with large text to see or observe. Remember, opening a buy or sell position isn't as simple as relying on numbers and colors. Each trading strategy has no more than a 5% chance of winning in the market. Therefore, stick to one trading strategy with complete mastery. Don't mix and match trading strategies. I use Overbought/Oversold, so I study everything related to Overbought.
{image} Market Display Monitor is a tool for observing market price movements. Sometimes, traders, whether they have already made a transaction or not, will briefly observe the currency they're targeting to determine its potential and risk. Some people simply need a visual with large text to see or observe. Remember, opening a buy or sell position isn't as simple as relying on numbers and colors. Each trading strategy has no more than a 5% chance of winning in the market. Therefore, stick to one trading strategy with complete mastery. Don't mix...
Ignored
Hello, bro! I noticed you use the Overbought/Oversold strategy, and it seems like you're really skilled at it. Could I kindly ask for some insights? For example, which indicators do you find reliable for spotting Overbought/Oversold conditions, or any tips to avoid making wrong entries? Thanks a lot in advance!
{quote} Hello, bro! I noticed you use the Overbought/Oversold strategy, and it seems like you're really skilled at it. Could I kindly ask for some insights? For example, which indicators do you find reliable for spotting Overbought/Oversold conditions, or any tips to avoid making wrong entries? Thanks a lot in advance!
Ignored
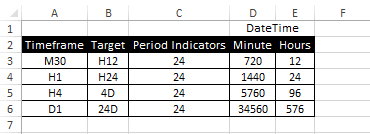
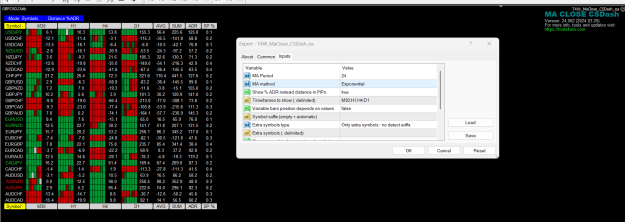
Step One: Timeframe: Use M30, H1, H4, and D1—just those four.
Step Two: Period: Provide a rationale for the period number.
Attached Image (click to enlarge)
Step Three: I'll give an example using a simple indicator, the Moving Average. Open 4 charts (4 different timeframes (M30, H1, H4, D1). Enter the MA indicator with a period of 24. Calculate the distance between the current price and the MA. If the price is above or below the MA by 20 pips in all 4 timeframes, the final step is to find the entry point.
Step Four: If the price is below the buy open and if the price is above the sell open, follow these four rules:
1. Calculate the risk per trade. For example, if I use a lot size of 0.01, how much risk do I have of losing money and how much profit can I make? For example, RR 1:2.
2. Is the market volatile? Use ATR/ADX/Market Display Monitor.
3. Am I entering based on my strategy or based on emotion/FOMO?
4. Are the fundamentals safe (is there any high news or is the currency experiencing anomalous behavior?) For example, JPY, this currency tends to fall or rise continuously without any resistance.
I know that the more I know, the more I don't know
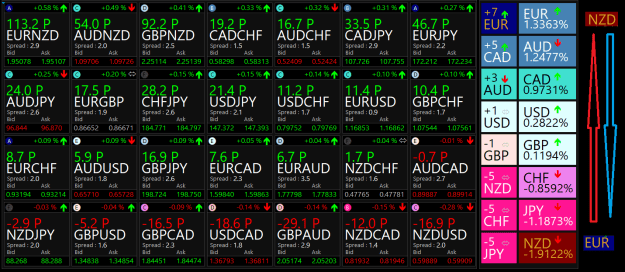
I'll give a real example: valid for this week, pay attention to EURNZD, a good target for a sell entry.
Rule 1: Determine the risk per trade.
Rule 2: Volatility: I use the Market Display Monitor, I wait for the NZD to be above the EUR (NZD +3/+5) and (EUR -3/-5).
Attached Image (click to enlarge)
Rule 3. Use Strategy or Emotion? Use Strategy -> Next Rule 4.
Rule 4. Fundamentals (High News or Notes) Especially for the currency (JPY), Fundamentals are OK -> Entry SELL
It's very simple; it just requires practice, absolute rules, and a trade journal (recording trades and the reason for entry).
Salam Indo
Zorox
I know that the more I know, the more I don't know
I'll give a real example: valid for this week, pay attention to EURNZD, a good target for a sell entry. Rule 1: Determine the risk per trade. Rule 2: Volatility: I use the Market Display Monitor, I wait for the NZD to be above the EUR (NZD +3/+5) and (EUR -3/-5). {image} Rule 3. Use Strategy or Emotion? Use Strategy -> Next Rule 4. Rule 4. Fundamentals (High News or Notes) Especially for the currency (JPY), Fundamentals are OK -> Entry SELL It's very simple; it just requires practice, absolute rules, and a trade journal (recording trades and the...
Ignored
Dear sir
Due to EURNZD current it is Rang "A" a good target for a sell entry
{quote} Dear sir Due to EURNZD current it is Rang "A" a good target for a sell entry
Ignored
It's not like that. Pay attention to the steps. Measure the distance between the price and the moving average (-/+ 20 pips) (M30, H1, H4, D1). Assume it's met. The second step is the entry point when the EUR is below the NZD. Simply put, the daily heatmap has a negative value. Grade A simply indicates that our target is this pair.
There are 6 pairs with grades (A or B). We just have to wait and see which one meets our trading strategy. You must strictly adhere to the rules. Remember, 95% of losses are due to emotional trading (the impact of looking at colors and numbers). This can be eliminated with a trading journal.
I know that the more I know, the more I don't know
{quote} Step One: Timeframe: Use M30, H1, H4, and D1—just those four. Step Two: Period: Provide a rationale for the period number. {image} Step Three: I'll give an example using a simple indicator, the Moving Average. Open 4 charts (4 different timeframes (M30, H1, H4, D1). Enter the MA indicator with a period of 24. Calculate the distance between the current price and the MA. If the price is above or below the MA by 20 pips in all 4 timeframes, the final step is to find the entry point. Step Four: If the price is below the buy open and if the price...
Ignored
note Step Three: I'll give an example using a simple indicator, the Moving Average. Open 4 charts (4 different timeframes (M30, H1, H4, D1). Enter the MA indicator with a period of 24. Calculate the distance between the current price and the MA. If the price is above or below the MA by 20 pips in all 4 timeframes, the final step is to find the entry point. Summary and Explanation:(make clearly my understanding )
You want to use the Moving Average (MA) indicator with a period of 24 across four timeframes (M30, H1, H4, D1) to analyze market prices and identify potential trading entry points. The steps are as follows:
Set up the MA: Apply a Simple Moving Average (SMA) or Exponential Moving Average (EMA) with a period of 24 on each timeframe (M30, H1, H4, D1) on the price chart.
Calculate the Distance: Measure the distance between the current price (e.g., the closing price of the latest candle) and the MA value in each timeframe, expressed in pips
Trading Condition:
Check if the current price is above or below the MA by at least 20 pips in all four timeframes.
If the price is above the MA by 20 pips in all timeframes → Consider a Buy trade.
If the price is below the MA by 20 pips in all timeframes → Consider a Sell trade.
Find the Entry Point:
Once the condition is met (price is above or below the MA by 20 pips in all timeframes), the entry point depends on additional strategies, such as:
Entering a buy/sell trade immediately when the condition is met.
Waiting for further confirmation, e.g., a price pullback or signals from other indicators (like RSI or MACD).
Using a smaller timeframe (e.g., M30 or H1) to fine-tune the entry timing.
Example Calculation:
Assume you’re trading the EUR/USD pair, and the current prices are:
M30: Price = 1.1850, MA(24) = 1.1820
H1: Price = 1.1855, MA(24) = 1.1822
H4: Price = 1.1860, MA(24) = 1.1825
D1: Price = 1.1845, MA(24) = 1.1810
Steps:
Calculate the distance (in pips):
M30: 1.1850 - 1.1820 = 0.0030 = 30 pips
H1: 1.1855 - 1.1822 = 0.0033 = 33 pips
H4: 1.1860 - 1.1825 = 0.0035 = 35 pips
D1: 1.1845 - 1.1810 = 0.0035 = 35 pips
Check the condition:
The price is above the MA by more than 20 pips in all timeframes (30, 33, 35, 35 pips > 20 pips).
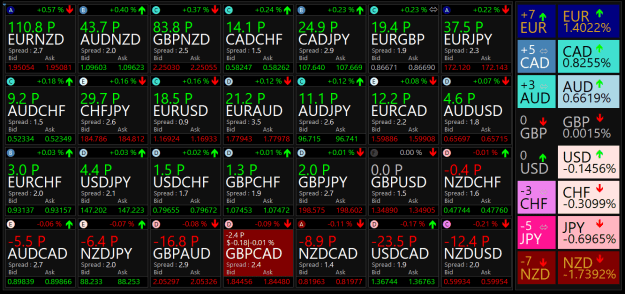
{image} I tried buying GBPCAD using certain calculations and rules. I added visuals to monitor the transaction. ^_^
Ignored
Attached Image (click to enlarge)
Attached Image (click to enlarge)
I'm an impulsive person. So, with a trading journal, I can analyze many of my mistakes. The fact is, I've discovered that most of my mistakes are driven by emotion, not trading strategy.
This is just an example of a case study I can share.
So, if you don't have a trading journal, I can say 100% that you'll make the same mistakes 1,000 times. But if you start with a trading journal, you're truly on the path to success.
Salam Indo
Zorox
I know that the more I know, the more I don't know
{quote} note Step Three: I'll give an example using a simple indicator, the Moving Average. Open 4 charts (4 different timeframes (M30, H1, H4, D1). Enter the MA indicator with a period of 24. Calculate the distance between the current price and the MA. If the price is above or below the MA by 20 pips in all 4 timeframes, the final step is to find the entry point. Summary and Explanationmake clearly my understanding ) You want to use the Moving Average (MA) indicator with a period of 24 across four timeframes (M30, H1, H4,...
Ignored
Attached Image (click to enlarge)
Some people use weekly pivot points as a tool. They sell when the price is at X (above the pivot point) and buy when the price is below the pivot point. The concept is the same as overbought/oversold. The key to profit is an indicator that can detect price reversal patterns.
I know that the more I know, the more I don't know
{quote} {image} Some people use weekly pivot points as a tool. They sell when the price is at X (above the pivot point) and buy when the price is below the pivot point. The concept is the same as overbought/oversold. The key to profit is an indicator that can detect price reversal patterns.
Ignored
Dear Zorox
thank you for your reply .. let me confirmed MA is it SMA24 or EMA 24 for your template ,, and your find out enty point in TF M30 righ ?
{quote} Dear Zorox thank you for your reply .. let me confirmed MA is it SMA24 or EMA 24 for your template ,, and your find out enty point in TF M30 righ ?
Ignored
Attached Image (click to enlarge)
example, consider the current EUR/GBP. I analyze using moving average (MA 200). I open the M30, H1, and H4 charts, and the price is above the MA. Now, look at the market monitor display and see that GBP is currently above EUR, meaning GBP is stronger than EUR. I'm currently waiting for the daily percentage for EUR/GBP to fall below -0.10% to -0.25% and then I'm selling...
Whether it's a 24-day moving average (MA), a 50-day moving average (MA), or a 200-day moving average (MA), remember that numbers and colors don't mean anything. The chart I'm viewing shows EUR/GBP is overbought. I'm holding back from selling until the daily percentage meets my standards.
I know that the more I know, the more I don't know