Hello everyone,
It’s been a long time since I was active in the forex market and forums. This is my first thread, and maybe it will be my last. For years, I blew up dozens of forex accounts. I achieved some sustainable success with technical analysis, but only up to a certain point. After that, I gave in to my emotions, got greedy, and so on. I stayed away for a long time.
Financial markets have a complex structure and are difficult to predict due to their speculative nature. However, I am among those who believe there is an underlying algorithm behind it. That’s why, with advancing technology, I developed an automation using artificial intelligence.
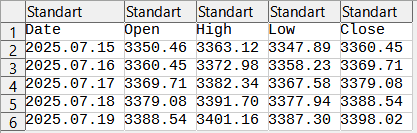
What exactly does this system do? In short, it is an AI code that reads and learns from historical data to predict future data — in other words, candlesticks. I won’t be sharing this system with you, but I will share something else: I will try to share the opening, closing, low, and high levels of the next 10 four-hour (4H) candlesticks with as little error as possible.
I want to talk a little bit about the errors. The predicted prices may not match exactly, and there are error rates involved. However, I’m sharing these predictions in the hope that they will help you when analyzing and trading. For now, I will share this for free, and later I plan to create a Telegram group.
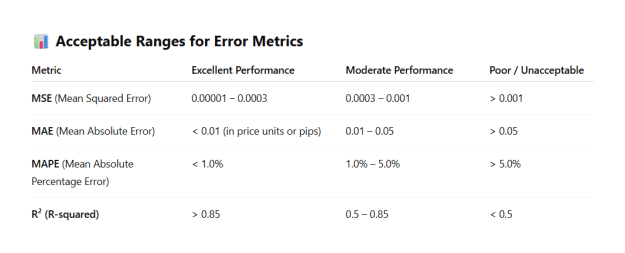
Let me explain a bit about the errors.
MSE (Mean Squared Error)
Explanation:
MSE measures the average of the squares of the errors—that is, the average squared difference between the predicted values and the actual values. It penalizes larger errors more heavily because of the squaring.
Formula:
MSE=1n∑i=1n(yi−y^i)2\text{MSE} = \frac{1}{n} \sum_{i=1}^{n} (y_i - \hat{y}_i)^2MSE=n1i=1∑n(yi−y^i)2
where yiy_iyi is the actual value, and y^i\hat{y}_iy^i is the predicted value.
Forex Meaning:
In Forex, MSE can measure how far the predicted price levels (e.g., candlestick open, close, high, low) are from the actual market prices. A lower MSE means the prediction model is more accurate.
MAPE (Mean Absolute Percentage Error)
Explanation:
MAPE expresses the average absolute difference between predicted and actual values as a percentage of the actual values. It provides a scale-independent measure of prediction accuracy.
Formula:
MAPE=100%n∑i=1n∣yi−y^iyi∣\text{MAPE} = \frac{100\%}{n} \sum_{i=1}^{n} \left| \frac{y_i - \hat{y}_i}{y_i} \right|MAPE=n100%i=1∑nyiyi−y^i
Forex Meaning:
In Forex, MAPE tells you the average percentage error of your price predictions, which is useful to understand the relative size of errors in the context of fluctuating currency prices.
MAE (Mean Absolute Error)
Explanation:
MAE calculates the average of the absolute differences between predicted and actual values. It shows how far predictions are from the actual values on average, without squaring the errors.
Formula:
MAE=1n∑i=1n∣yi−y^i∣\text{MAE} = \frac{1}{n} \sum_{i=1}^{n} |y_i - \hat{y}_i|MAE=n1i=1∑n∣yi−y^i∣
Forex Meaning:
In Forex, MAE represents the average magnitude of errors in price predictions, giving a straightforward interpretation of how much the predicted price differs from the real price on average.
Anyway, these errors are present in the predictions I will be sharing, and these forecasts do not constitute financial advice or guaranteed buy/sell signals. Therefore, I encourage everyone to take personal responsibility and make their own decisions.
I’m not interested in engaging in pointless arguments with anyone. I will only be sharing my analysis and predictions related to gold (XAU/USD).
And one last note: since the code doesn’t always detect the dates correctly on the chart, some of the predicted candlesticks may occasionally fall on weekends. I’ll try to provide the data as accurately as possible.
Thanks for now!
It’s been a long time since I was active in the forex market and forums. This is my first thread, and maybe it will be my last. For years, I blew up dozens of forex accounts. I achieved some sustainable success with technical analysis, but only up to a certain point. After that, I gave in to my emotions, got greedy, and so on. I stayed away for a long time.
Financial markets have a complex structure and are difficult to predict due to their speculative nature. However, I am among those who believe there is an underlying algorithm behind it. That’s why, with advancing technology, I developed an automation using artificial intelligence.
What exactly does this system do? In short, it is an AI code that reads and learns from historical data to predict future data — in other words, candlesticks. I won’t be sharing this system with you, but I will share something else: I will try to share the opening, closing, low, and high levels of the next 10 four-hour (4H) candlesticks with as little error as possible.
I want to talk a little bit about the errors. The predicted prices may not match exactly, and there are error rates involved. However, I’m sharing these predictions in the hope that they will help you when analyzing and trading. For now, I will share this for free, and later I plan to create a Telegram group.
Let me explain a bit about the errors.
MSE (Mean Squared Error)
Explanation:
MSE measures the average of the squares of the errors—that is, the average squared difference between the predicted values and the actual values. It penalizes larger errors more heavily because of the squaring.
Formula:
MSE=1n∑i=1n(yi−y^i)2\text{MSE} = \frac{1}{n} \sum_{i=1}^{n} (y_i - \hat{y}_i)^2MSE=n1i=1∑n(yi−y^i)2
where yiy_iyi is the actual value, and y^i\hat{y}_iy^i is the predicted value.
Forex Meaning:
In Forex, MSE can measure how far the predicted price levels (e.g., candlestick open, close, high, low) are from the actual market prices. A lower MSE means the prediction model is more accurate.
MAPE (Mean Absolute Percentage Error)
Explanation:
MAPE expresses the average absolute difference between predicted and actual values as a percentage of the actual values. It provides a scale-independent measure of prediction accuracy.
Formula:
MAPE=100%n∑i=1n∣yi−y^iyi∣\text{MAPE} = \frac{100\%}{n} \sum_{i=1}^{n} \left| \frac{y_i - \hat{y}_i}{y_i} \right|MAPE=n100%i=1∑nyiyi−y^i
Forex Meaning:
In Forex, MAPE tells you the average percentage error of your price predictions, which is useful to understand the relative size of errors in the context of fluctuating currency prices.
MAE (Mean Absolute Error)
Explanation:
MAE calculates the average of the absolute differences between predicted and actual values. It shows how far predictions are from the actual values on average, without squaring the errors.
Formula:
MAE=1n∑i=1n∣yi−y^i∣\text{MAE} = \frac{1}{n} \sum_{i=1}^{n} |y_i - \hat{y}_i|MAE=n1i=1∑n∣yi−y^i∣
Forex Meaning:
In Forex, MAE represents the average magnitude of errors in price predictions, giving a straightforward interpretation of how much the predicted price differs from the real price on average.
Anyway, these errors are present in the predictions I will be sharing, and these forecasts do not constitute financial advice or guaranteed buy/sell signals. Therefore, I encourage everyone to take personal responsibility and make their own decisions.
I’m not interested in engaging in pointless arguments with anyone. I will only be sharing my analysis and predictions related to gold (XAU/USD).
And one last note: since the code doesn’t always detect the dates correctly on the chart, some of the predicted candlesticks may occasionally fall on weekends. I’ll try to provide the data as accurately as possible.
Thanks for now!
Attached Image (click to enlarge)