Daily AUDUSD Technical Analysis & Trading Signals (July 06)
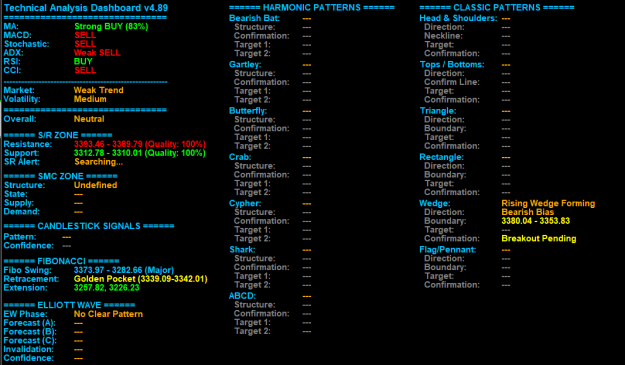
Analysis: The dashboard indicates a strong SELL bias across most indicators on the H4 timeframe. Moving Averages (MA), MACD, Stochastic, and RSI all signal SELL, with MA showing a 67% sell strength. ADX suggests a Weak SELL, while CCI is Oversold, hinting at a potential reversal or exhaustion of the selling pressure.
Overall, the combined analysis across M5, M30, and H1 timeframes points to a Strong SELL (40%). This reinforces the bearish sentiment observed on the H4 chart, suggesting a consistent downward momentum across shorter to medium timeframes.
The market is currently in a Weak Trend with Medium Volatility. The Smart Money Concept (SMC) structure shows a Bullish (BOS), indicating a break of structure to the upside, and the price is currently Waiting for Pullback. This suggests that despite the short-term bearish indicators, the underlying structure is bullish, and a pullback is anticipated before a potential continuation of the bullish move.
The nearest Resistance zone is identified between 0.6688 - 0.6664, and the nearest Support zone is 0.6401 - 0.6373. Given the Bullish (BOS) and the "Waiting for Pullback" state, the current market situation suggests that the price might retrace towards the Demand zone of 0.6495 - 0.6447 (Buy Entry Zone) before potentially resuming its bullish trajectory. The probable directional bias, considering the SMC structure, leans towards a BUY after a pullback, despite the current strong sell signals from traditional indicators.
 Download link: Google drive

 Want to learn all this directly from me — step-by-step?
 I now offer FREE 1-on-1 Forex mentorship where I guide you personally via Telegram, email, and video calls.
 Learn advanced trading strategies
Get access to tools, indicators & EAs
Ask anything, anytime — I’m here to help you grow
No cost to you — mentorship is 100% free
 Start your free mentorship journey here → https://in.cliobra.com/
Direct Telegram contact → https://t.me/cliobra
 Serious about mastering forex? It starts with the right support — let’s grow together.
Analysis: The dashboard indicates a strong SELL bias across most indicators on the H4 timeframe. Moving Averages (MA), MACD, Stochastic, and RSI all signal SELL, with MA showing a 67% sell strength. ADX suggests a Weak SELL, while CCI is Oversold, hinting at a potential reversal or exhaustion of the selling pressure.
Overall, the combined analysis across M5, M30, and H1 timeframes points to a Strong SELL (40%). This reinforces the bearish sentiment observed on the H4 chart, suggesting a consistent downward momentum across shorter to medium timeframes.
The market is currently in a Weak Trend with Medium Volatility. The Smart Money Concept (SMC) structure shows a Bullish (BOS), indicating a break of structure to the upside, and the price is currently Waiting for Pullback. This suggests that despite the short-term bearish indicators, the underlying structure is bullish, and a pullback is anticipated before a potential continuation of the bullish move.
The nearest Resistance zone is identified between 0.6688 - 0.6664, and the nearest Support zone is 0.6401 - 0.6373. Given the Bullish (BOS) and the "Waiting for Pullback" state, the current market situation suggests that the price might retrace towards the Demand zone of 0.6495 - 0.6447 (Buy Entry Zone) before potentially resuming its bullish trajectory. The probable directional bias, considering the SMC structure, leans towards a BUY after a pullback, despite the current strong sell signals from traditional indicators.
Attached Image (click to enlarge)