SMA is that red line just like we have on the QQE. yes i am just learning the system and thanks for your patience and help.
Ignored
No. SMA=Simple Moving Average which will draw a line where the average volume is. Simple is the type of moving average where others are accelerated (like exponential) Since the volume changes, the average volume will change but much much slower. 50 is the number of bars back it will average at any point. But it will look like a straight line.
The QQE line is a fixed line at 50, not a moving average.
Ignored
Thanks for your patience and time AI, just 1 last question if anyone can answer, how do i aply the sma on my volume chart? i am using VT charts and found the volume on the indicators. when i try to attach a indicator to the volume, the only options i get with the moving average are, macd-rsi-envelope.
Thanks for your patience and time AI, just 1 last question if anyone can answer, how do i aply the sma on my volume chart? i am using VT charts and found the volume on the indicators. when i try to attach a indicator to the volume, the only options i get with the moving average are, macd-rsi-envelope.
Ignored
Right click on the word "volume" in the volume window. Then add indicator from there. Just use "Moving Average" it is simple by default.
WSJ COMMENTS ON HOW THE RECENT VOLATILITY HAS HURT QUANTIATIVE FUNDS; REPORTS THAT GOLDMAN SACHS' GLOBAL ALPHA FUND IS NOW DOWN ABOUT 16% FOR 2007, AFTER BEING DOWN ABOUT 8% IN JULY - WSJ
- The Goldman Sachs fund manages about $9B.
- Note over the past few weeks Goldman has denied rumors that it would close the Alpha Fund. Also it was reported on 8/6 in the FT that the fund posted a loss of 7.7% before fees in the week ended July 27, taking its performance for the year to down 12.1% before fees.<XLF IYF>
You will have these announcements from time to time that will bring down the carry trades. Keep a lookout.
Now can someone wake me up?! This 5 pip range is brutal !!
Joined Feb 2007
|
Status: Trade @ your own risk
|6,628 Posts
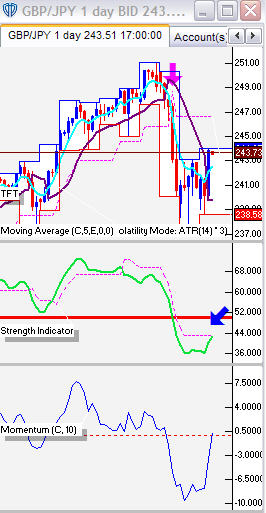
There will be no movment during the asia... if 30min cross over the 50 line there will some movement .. untill then I rather play with my neighbours three legged dog
question: just before the big movement began @3AM EST, the charts took a sudden dip (a fake as you like to call it).... how did you distinguish the fake even when the indicators were all pointing towards a strong bearish signal. There was a fresh strong bearish slope and cross at the 50 on the early indicators (10min). a nice bounce on the 30min....a fresh cross on the 1hr and good slope on the 4hr. I know hindsight is 20/20 but at that moment....it looked like it was about to break for the downside. How do we stay clear of these fakes in the future ?
question: just before the big movement began @3AM EST, the charts took a sudden dip (a fake as you like to call it).... how did you distinguish the fake even when the indicators were all pointing towards a strong bearish signal. There was a fresh strong bearish slope and cross at the 50 on the early indicators (10min). a nice bounce on the 30min....a fresh cross on the 1hr and good slope on the 4hr. I know hindsight is 20/20 but at that moment....it looked like it was about to break for the downside. How do we stay clear of these fakes in the future ?
p.s. i'm still paper trading at the moment.
Ignored
HI AWG,
Even When the marklet was taking a dip... Neither 4hr or 1hr was pointing down..they were always crossed, upside.. Since those two main time frames still bullish according to the strategy, I didnt worry about a downside momvement.
I was waiting to catch a retrecement after the bullish shoot if the 15min crossed down the 50 line... but it never crossed down either..
In the mean time, what do you think? Should I close my short positions?
Or open some long ones? Or stay out?
Frank
Ignored
to be honest frank, I dont know which way the market will turn...A good 100 pip retracement is still due, but so far there are no signs of it at all... ..
This could also break to the upside again. The best to do is stay away untill the 30 mins cross upwards or cross down the 50 line..
There will be about 50-100 pips for the 30 minutes time frame.
There will be no movment during the asia... if 30min cross over the 50 line there will some movement .. untill then I rather play with my neighbours three legged dog
Ignored
That is funny, I was doing the same thing this afternoon after the market went dead.
to be honest frank, I dont know which way the market will turn...A good 100 pip retracement is still due, but so far there are no signs of it at all... ..
This could also break to the upside again. The best to do is stay away untill the 30 mins cross upwards or cross down the 50 line..
There will be about 50-100 pips for the 30 minutes time frame.
Ignored
Can we expect the breaks today? At London open? Or tomorrow? Next week? And lastly: how do you predict when this breakouts will occur? Thanks.