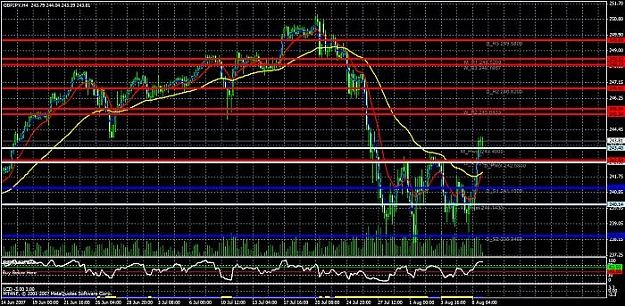
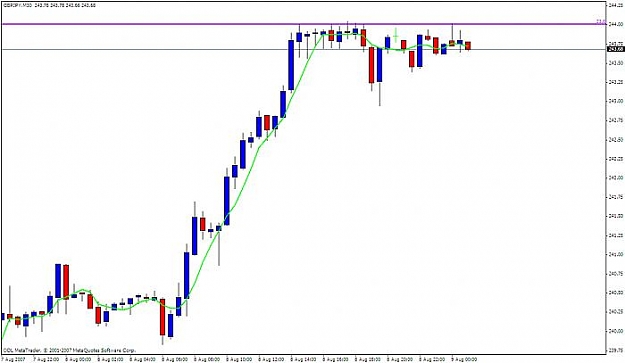
I think if this monthly pivot pt at 243.40 breaks we may see a drop to the former resistance line at 242.70 area before it goes back up
 Auslanco - GBP/JPY and GBP/USD (newstrade)
- #5,204
- Edited 7:10pm Aug 8, 2007 6:57pm | Edited 7:10pm
- | Joined Dec 2006 | Status: Trader | 1,556 Posts