Precision Trading Setup for Bulls Eye Entries
As we enter June 2025, EUR/USD continues to build bullish momentum across all major timeframes. Price has broken out of its consolidation structures, supported by key technical confluences including moving averages, Bollinger bands, and oscillators. Here’s a structured deep-dive across H1, H4, Daily, and Weekly timeframes to prepare swing, position, and short-term scalping entries.
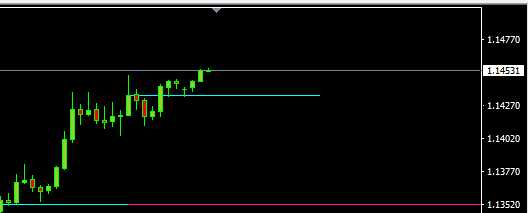
- Higher highs and higher lows indicate a strong intraday uptrend.
- Price recently broke out above short-term resistance at 1.1350.
- Candles closing above the Bollinger band midline and 50 EMA.
![]() Indicators:
Indicators:
- 50 EMA > 200 EMA = Confirmed short-term bullish trend.
- RSI climbing towards 70 = momentum strong but nearing overbought.
- Stochastic Oscillator in overbought zone, but still bullish crossover.
![]() Insights:
Insights:
- Short-term breakout with Bollinger Band expansion = volatility entry zone.
- Dynamic support forming at 1.1325–1.1340 (previous breakout + 20 EMA).
![]() Intraday Bias: Bullish
Intraday Bias: Bullish
![]() Ideal for breakout traders and 2:1 scalp setups on pullbacks.
Ideal for breakout traders and 2:1 scalp setups on pullbacks.
![]() 4-Hour Chart (H4) – Swing Structure Confirmation
4-Hour Chart (H4) – Swing Structure Confirmation
![]() Market Structure:
Market Structure:
- Clean reversal from bearish channel.
- Bullish engulfing followed by continuous uptrend forming a rising wedge.
- Price trading well above Ichimoku cloud support.
![]() Indicators:
Indicators:
- 50 EMA crossing 200 EMA = Bullish crossover.
- Bollinger Bands widening = volatility injection.
- RSI at 60+, trending without divergence.
- Stochastic bullish and mid-slope = room for continuation.
![]() Key Zone:
Key Zone:
- Consolidation re-tested at 1.1280–1.1300 — now acting as demand.
![]() Swing Bias: Strongly Bullish
Swing Bias: Strongly Bullish
![]() Best timeframe for pullback-based swing entries. Re-entry zones: 1.1315–1.1345.
Best timeframe for pullback-based swing entries. Re-entry zones: 1.1315–1.1345.
![]() Daily Chart – Macro Trend Clarity
Daily Chart – Macro Trend Clarity
![]() Trend Landscape:
Trend Landscape:
- Breakout from prolonged accumulation phase.
- Rounded bottom completed; price in impulsive phase 2.
- 50 and 200 MAs in strong uptrend alignment.
![]() Indicators:
Indicators:
- RSI sustaining above 60 = mid-uptrend health.
- Stochastic crossover near 65 = good continuation potential.
- Bollinger Bands wide and price hugging upper band = bullish confidence.
![]() Support/Resistance:
Support/Resistance:
- Support: 1.1200 (structure base), 1.1275 (mid-term retest zone)
- Target: 1.1385 → 1.1450 → 1.1625 (extension based on fib & prior tops)
![]() Daily Bias: Confirmed Bullish Trend
Daily Bias: Confirmed Bullish Trend
![]() Ideal for multi-day holds, pyramid entries, and trailing stop strategy.
Ideal for multi-day holds, pyramid entries, and trailing stop strategy.
![]() Weekly Chart – Investor Sentiment & Big Picture
Weekly Chart – Investor Sentiment & Big Picture
![]() Long-Term Overview:
Long-Term Overview:
- Rounded bottom formed between Sep 2022–Feb 2024.
- Breakout retested, new uptrend in motion.
- Price holding above Ichimoku cloud and all key SMAs.
![]() Indicators:
Indicators:
- RSI: Rising, not overbought — strength without exhaustion.
- Stochastic: Mid-range bullish slope — confirms momentum isn't over.
- Bollinger Bands: Opening up after squeeze — indicative of macro breakout.
![]() Key Macro Levels:
Key Macro Levels:
- Support: 1.1100 (Weekly pivot)
- Resistance: 1.1390 → 1.1650 → 1.1780
![]() Weekly Bias: Long-Term Bullish
Weekly Bias: Long-Term Bullish
![]() Perfect for position traders and fund-flow tracking.
Perfect for position traders and fund-flow tracking.
![]() Trade Setup Summary (As of 02 June 2025)
Trade Setup Summary (As of 02 June 2025)
Time frame Bias Entry Zone SLTP Targets
H1Bullish Momentum1.1340–1.1355 (pullback)1.13151.1385 / 1.1410
H4Swing Bullish1.1320–1.13451.12801.1450 / 1.1500
Daily Confirmed Uptrend1.1270–1.13001.12101.1490 / 1.1620
Weekly Macro Bullish Re-entry on dips > 1.12501.11001.1650 / 1.1780
![]() Risk Note
Risk Note
This setup assumes trend continuation. If EUR/USD breaks below 1.1270 on high volume and closes daily under the 50 EMA, bias invalidation kicks in.
![]() Pro Tip:
Pro Tip:
“A trend that survives the H4 chart but fails on the Daily is just noise. Respect structure. Trust confluence. And never forget — sideways kills more accounts than reversals ever did.”
![]() Conclusion
Conclusion
EUR/USD is showing coordinated bullish structure across all timeframes. Whether you’re scalping or positioning for macro trends, this is a rare alignment phase where technical, structural, and momentum indicators agree. Don’t chase. Plan your re-entries. Let price come to you. Markets reward patience, not panic.