You can download from this link:
https://cdn.tradingfinder.com/file/4...4_by_tflab.zip
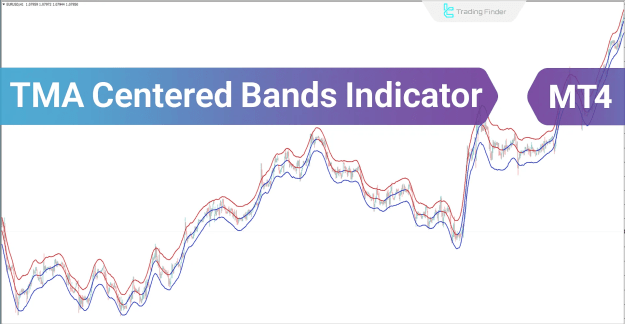
The indicator consists of three bands:
- Upper Band (Red) – Signals potential overbought conditions.
- Middle Band (Red/Blue) – Changes color based on trend direction.
- Lower Band (Blue) – Signals potential oversold conditions.
When the price moves outside the bands, it tends to re-enter, creating buy and sell signals:
![]() Exit Lower Band → Re-enter → Buy Signal (Bullish)
Exit Lower Band → Re-enter → Buy Signal (Bullish)
![]() Exit Upper Band → Re-enter → Sell Signal (Bearish)
Exit Upper Band → Re-enter → Sell Signal (Bearish)
Key Features of the TMA Indicator
Indicator Category:
- Type: Signal & Forecast, Bands & Channels
- Platform: MetaTrader 4
- Skill Level: Beginner
- Indicator Types: Reversal, Breakout
- Timeframes: Multi-Timeframe
- Trading Styles: Scalping, Day Trading, Swing Trading
- Trading Instruments: All Markets (Forex, Stocks, Indices, Commodities, Crypto)
How the TMA Indicator Works
The TMA Centered Bands uses a moving average with ATR-based volatility adjustments to smooth price action.
- Middle Band turns blue in uptrends and red in downtrends.
- Outer Bands act as dynamic support and resistance levels.
When price exits and re-enters a band, it signals a trend reversal.
Buy & Sell Signals from the TMA Indicator
Uptrend Signals (Buy Positions)
Example: NASDAQ (NAS100) – 4-Hour Chart
- At points A, B, and C, price breaks below the lower band and re-enters, turning the middle band blue.
- This generates a Buy Signal, indicating a potential bullish trend.
![]() Buy Signal: Enter long positions when price exits the lower band and re-enters, confirming the uptrend.
Buy Signal: Enter long positions when price exits the lower band and re-enters, confirming the uptrend.
![]() Additional Confirmation: Use RSI or other momentum indicators.
Additional Confirmation: Use RSI or other momentum indicators.
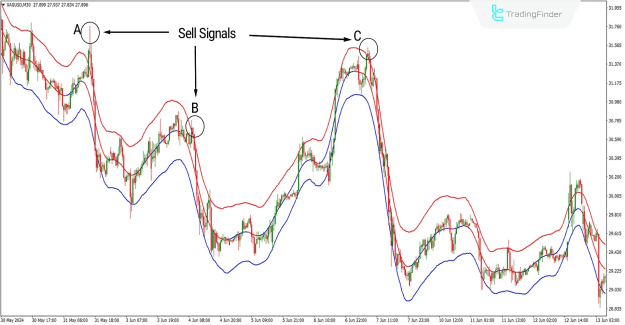
Downtrend Signals (Sell Positions)
Example: Silver (XAG/USD) – 30-Minute Chart
- At points A, B, and C, price breaks above the upper band and re-enters, turning the middle band red.
- This generates a Sell Signal, indicating a potential bearish trend.
![]() Sell Signal: Enter short positions when price exits the upper band and re-enters, confirming the downtrend.
Sell Signal: Enter short positions when price exits the upper band and re-enters, confirming the downtrend.
![]() Additional Confirmation: Use Stochastic Oscillator or other trend indicators.
Additional Confirmation: Use Stochastic Oscillator or other trend indicators.
Customizing the TMA Indicator
- HalfLength (12): Number of past candles used for averaging. Higher values smooth price action.
- Price (Close): Uses closing prices for calculations.
- ATR Period (50): A longer ATR period smooths volatility calculations.
- Type (ATR-based MA): Adjusts bands dynamically based on market volatility.
- Multiplier (2): Expands or contracts the bands based on ATR values.
- Deviation Lookback (10): Determines how far back price deviations are measured.
Summary: Why Use the TMA Indicator?
![]() Multi-Timeframe Compatibility – Works on all trading instruments and timeframes.
Multi-Timeframe Compatibility – Works on all trading instruments and timeframes.
![]() Easy Trend Visualization – Color-coded bands provide clear buy/sell signals.
Easy Trend Visualization – Color-coded bands provide clear buy/sell signals.
![]() Combines Trend & Volatility Analysis – Uses Moving Averages & ATR for accurate predictions.
Combines Trend & Volatility Analysis – Uses Moving Averages & ATR for accurate predictions.
![]() Ideal for Various Trading Styles – Suitable for scalpers, day traders, and swing traders.
Ideal for Various Trading Styles – Suitable for scalpers, day traders, and swing traders.
![]() Enhanced with Other Indicators – Best used alongside RSI, Stochastic, or Moving Averages.
Enhanced with Other Indicators – Best used alongside RSI, Stochastic, or Moving Averages.
By integrating the TMA Centered Bands Indicator into your MT4 trading strategy, you can identify high-probability trend reversals and trade with confidence. ![]()