Hi Emda, thanks for your reply...
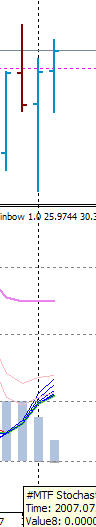
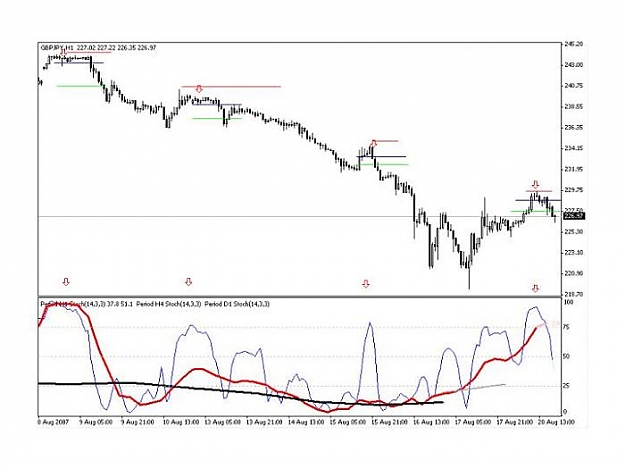
Please take a look at this picture. Could you please explain indicator that i marked with arrow, thanks...
I know it is elasticity indicator, if appear that histogram below, is it right that the price will go up after the stoch turning down?
Thanks again
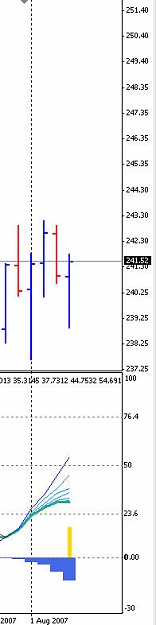
Please take a look at this picture. Could you please explain indicator that i marked with arrow, thanks...
I know it is elasticity indicator, if appear that histogram below, is it right that the price will go up after the stoch turning down?
Thanks again
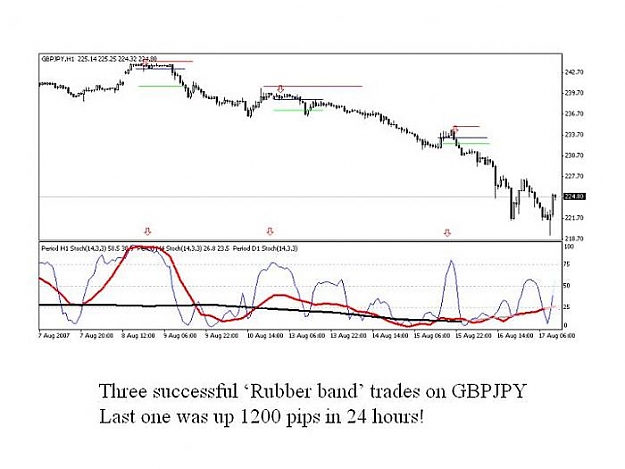
Attached Image