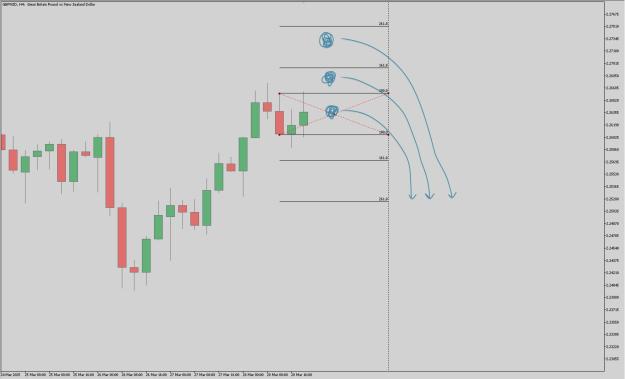
The candle didn't close as shown in the previous screenshot for a breakout to the upside to be more likely. Instead, it closed the way it did now. The three big candles with similar highs and lows showed price was consolidating, meaning buy and sell orders were stacking up on both sides. Traders who went long on the green candle probably had SL sell orders below the lows. Traders looking to short were likely placing pending sell stop orders below the range, expecting a breakdown. The green candle showed buyers trying to step in, but since it was stuck between two large red candles, they didn't have full control. Either buyers were weak, or larger players were using that bounce to build short positions. When the fourth candle broke down, you can see price moved up first to trigger SL buy orders from shorts before going lower. Once it dropped below the lows, it hit SL sell orders from long traders, adding more selling pressure. It also activated pending sell stop orders from traders waiting to short. Since there was more liquidity below than above, it became the better target for big players. Institutions and market makers look for clusters of SL sell orders because once those get triggered, momentum takes over. After those stops were cleared, the drop continued as more traders reacted. This is a common setup when price builds up liquidity in a tight range, and one side gets wiped out before the real move happens.

Attached Image (click to enlarge)
1