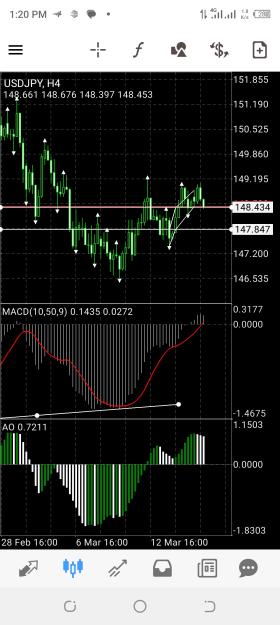
This image shows a trading chart for the USD/JPY currency pair (US Dollar vs. Japanese Yen) on a 4-hour timeframe. The chart displays price action, moving averages, and two technical indicators: the MACD (Moving Average Convergence Divergence) and the AO (Awesome Oscillator). The indicators and price action suggest a potential buying opportunity.
Attached Image (click to enlarge)