Why should I have all the headaches, I ask myself. Why not pass a few onto you guys?
Reviewing the recent past activity in my humble opinion is very important to understanding just how price action works. From this we can determine certain aspects that prove to be consistent over a long period of time past. This is important because we can assume the same will continue well into the future which is by default what we are interested in. By doing this past analysis for many years now it is become natural for me to react to situations much like driving a car. Reading a chart with graphics tells a story just the same as reading a book of words.
Today the world is riddled with conspiracy theories, this applies very much to trading as it is with any other debatable aspect. Personally, I don't disagree with other traders, but I will disregard stuff that has dubious evidence or stuff I don't understand because I am dumb. The shorter version of this paragraph is the proof is in the pudding.
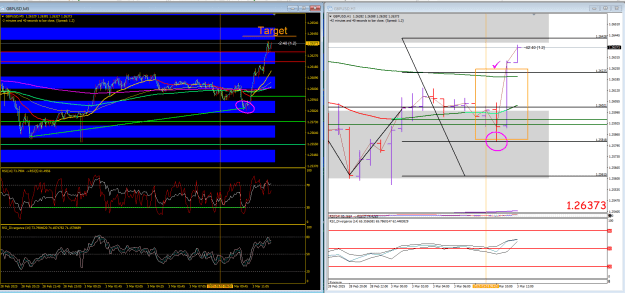
Below is the 1-hour chart within which there are many ZOO points for consideration at lower time levels to act upon. We can use much higher time frame charts, but these are going to take much longer to execute. This is not a bad thing since we can always reduce our lot size to allow for the larger drawdown, the wick on a daily chart can easily be 50 pips or more and then take the remainder of the day or days to come good. I will plot these higher time frames but by enlarge I use the 1 hour to look for my ZOO points and the targets levels I expect to reach.
Now for your headaches! See if you can follow the reasoning here for why price has taken this journey. I wouldn't expect all the answers to come from the one chart because things are happening in conjunction with higher time frame charts. There is however a great deal of information to be gleaned from this one chart.
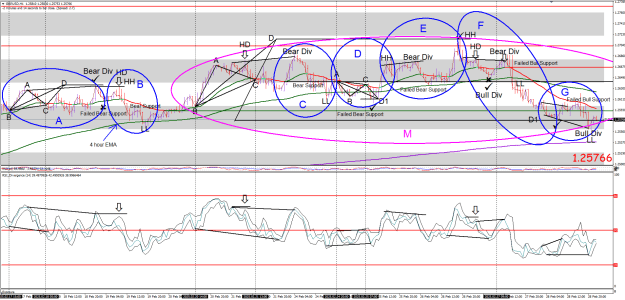
Each of the blue ovals is telling a story and the magenta oval is telling a bigger story. There is nothing on this chart that I have not already covered in some depth...
Why should I have all the headaches, I ask myself. Why not pass a few onto you guys? Reviewing the recent past activity in my humble opinion is very important to understanding just how price action works. There is however a great deal of information to be gleaned from this one chart. Each of the blue ovals is telling a story and the magenta oval is telling a bigger story. There is nothing on this chart that I have not already covered in some depth... {image} Enough for today, enjoy!...
Ignored
OK, let me try my best, in the capacity of a long-time student.
+ First of all, at the A oval, Price formed an ABCD pattern, so it could have kept dropping if it had found bear support—which it did not. Instead, Price tested the opposite side (attempting to form a HH) and completed the ABCD by hitting the D target. Note how Price reacted at that D target.
+ Second, at the B oval, there was a bear HD that caused Price to return to the EMA h1 and find bear support. We had hoped for a big down move, but in the broader picture, there was resistance from EMAH4, so Price rebounded to form HH.
Then, the second Bear div led Price to form a huge ABCD pattern (magenta oval). There were a lot of developments occurring within the D to D' range.
+ At the C oval, after a bull div, Price rallied in one continuous move but then encountered a Bear div that caused Price to return and cross EMA h1. Price established bear support and formed LL, but once again, Price could not break through the EMA h4. As a result, Price became stuck at the EMA h1 and h4 levels, as shown in the D oval. Note how Price completed the sell triangle ABC by hitting D1—representing 50% of D' of the magenta ABCD—and then rebounded. After the bull div at D1, Price formed HH and we moved to the E oval.
+ At the E oval, there was a bear div at the 50%D of the huge magenta ABCD, so Price returned and attempted to cross the EMA to find bear support, but failed due to the strong 4-hour EMA. Consequently, Price formed another HH and finally hit the D target of the huge magenta ABCD.
+ At the F oval, the bear hd caused Price to retest the C level of the huge magenta ABCD, and again a bull div produced HH as Price attempted to find bull support. It did find some, but that bull support failed, and Price dropped sharply. Note that once again, Price reacted at the 50%D of the huge magenta ABCD.
+ After the bears finally found support, Price reached the D1 target of the huge magenta ABCD and pulled back to test the EMA h1, but failed to find bull support. Consequently, Price continued to fall and formed a bullish divergence at the G oval, which caused Price to retest the 1-hour EMA.
+ That's all I can point out based on my knowledge. Please correct me if I'm wrong, Sir.
{quote} OK, let me try my best, in the capacity of a long-time student. + First of all, at the A oval, Price formed an ABCD pattern, so it could have kept dropping if it had found bear support—which it did not. Instead, Price tested the opposite side (attempting to form a HH) and completed the ABCD by hitting the D target. Note how Price reacted at that D target. + Second, at the B oval, there was a bear HD that caused Price to return to the EMA h1 and find bear support. We had hoped for a big down move, but in the broader picture, there was resistance...
{quote} and pulled back to test the EMA h1, but failed to find bull support. Consequently, Price continued to fall X and formed a bullish divergence at the G oval, which caused Price to retest the 1-hour EMA. + That's all I can point out based on my knowledge. Please correct me if I'm wrong, Sir.
Ignored
Excellent stuff, you have just about mastered this. The only thing I would add at the red X above is... Because the bull div did not find bull support we should expect a LL which is what happened and a new bull div was formed. (currently in play)
All the time we are watching the price structure. We are trying to determine what the future is going to be based upon what we perceive to be the evidence of the past. We may get it wrong from time to time but being correct most of the time. However, with the correct money management we put the mathematics of winning on our side.
Well done indeed, you should have no trouble honing your skills and becoming one of those 5% winners.
Also, I would add thanks for sharing your thought process. I know it is not easy to put all this into words we can easily follow.
The trick is to put what we know into reading the potential future movements of price action. All the moves on the chart are made by reason of what has gone before. Our task is to interpret this into profits.
When you see a div ask what is going on here. Is it at a ZOO level. Is it indicating a trade or a scalp. Scalps can easily turn into trades so where is the potential target, Can I make my profit from this. Is price just biding time awaiting some major news event before making the move. Once price makes its target can we profit from the bounce back. Is our risk/reward reasonable, a regular 2% profit is reasonable. Risking more than 1% is just plain stupid it may be hard to accept but a massive drawdown is far worse. Loose badly and it will trouble us for weeks. Loose a little and we get over it quickly.
We do not get into mind games or so-called psychology because it is impossible to just think trades. We have to be pro-active with evidence-based structures. The number of times I have heard people say, "I thought it was" and then did not take the appropriate action when their THOUGHTS were wrong. People are hard wired to not accept being wrong and will lose money defending themselves often with devastating results. People much more eloquent than I write whole books on this simple concept. I fall asleep reading them and spill my beer.
The trick is to put what we know into reading the potential future movements of price action. All the moves on the chart are made by reason of what has gone before. Our task is to interpret this into profits. When you see a div ask what is going on here. Is it at a ZOO level. Is it indicating a trade or a scalp. Scalps can easily turn into trades so where is the potential target, Can I make my profit from this. Is price just biding time awaiting some major news event before making the move. Once price makes its target can we profit from the bounce...
Ignored
I don't even think that the authors of those books are in the top 5%, but you are.
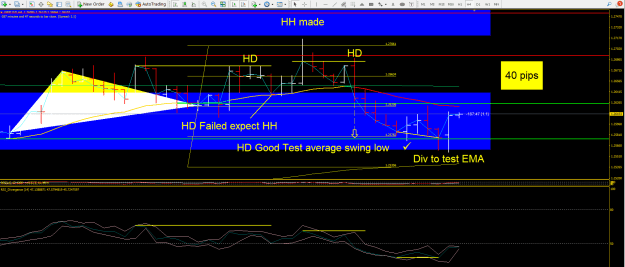
Here is a couple of 4-hour examples for those still not following this.
It begins with a signal of hidden divergence (HD). Now we hope price runs back to the EMA, crosses and finds support and then run on to test the lower average swing low. This is trading between the averages.
Price fails at the EMA, so we expect a higher high than the HD. This enacted as per expectations and in doing completed the ABCD hitting the D.
The process begins again with a second HD, it does run down to test the LL average as expected. What it didn't do was to find bear support before reaching the target.
Since the LL average was hit, we can assume the bull div formed to raise the price back to test the current EMA.
If we take all these relevant levels into consideration as ZOO points, we can trade them at the lower levels to get better positionings especially for our stops. We can thus have tight stops for large targets. This puts the mathematics greatly in our favor for low risk/high reward.
Here is a couple of 4-hour examples for those still not following this. It begins with a signal of hidden divergence (HD). Now we hope price runs back to the EMA, crosses and finds support and then run on to test the lower average swing low. This is trading between the averages. Price fails at the EMA, so we expect a higher high than the HD. This enacted as per expectations and in doing completed the ABCD hitting the D. The process begins again with a second HD, it does run down to test the LL average as expected. What it didn't do was to find bear...
Ignored
There are many type of ABCD that make me so confused, Sir. Pls give me some advices, thank you.
Last week stilll another BE. Well, keep talking about BE is boring. so i will only infor when i win then.
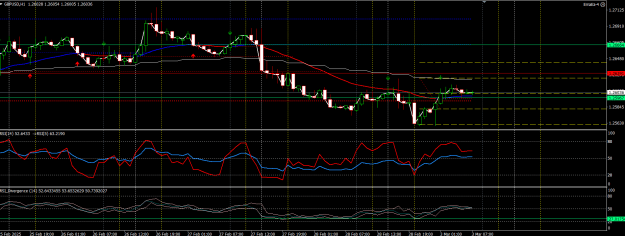
Attached Image (click to enlarge)
Today, let's see. As Alan show, H4 in DIV bull --> return to H4 EMA. On H1, we have HD bull here, price just finish build bull support. Currently price hide below to not form DIV bear so it have very good chance to target ABCD or H1 EMA swing 2668.
On other side, if price is not spike up, then we have good chance to go down. RSI fast is high and we still under EMA H4, so maybe H1 close in DIV bear, and better is cross H4 and we will have a decent short.
Oops, I meant there are many ABCD patterns I could draw. I use an indicator that shows some ABCD patterns that are different from yours, and that confuses me, sir
{quote} Oops, I meant there are many ABCD patterns I could draw. I use an indicator that shows some ABCD patterns that are different from yours, and that confuses me, sir
{quote} Oops, I meant there are many ABCD patterns I could draw. I use an indicator that shows some ABCD patterns that are different from yours, and that confuses me, sir
Ignored
Yes, that indicator seems to draw strange ones.
It is the first close across the EMA which is the C point.
A is the Apex of the triangle but should not be a divergence.
B is the bottom of the triangle not in divergence.
B and C, A and C should always be on opposite sides of the EMA depending on whether it is bullish or bearish.
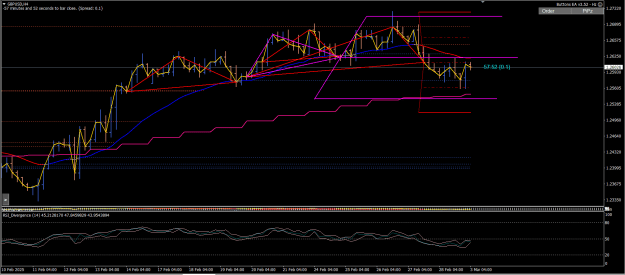
We can now see on the 1-hour chart it is going to take a long time to set up a new ABCD.
We could be looking for smaller signals on the lower time frames or indeed there is a much larger one on the daily of which we are at the 50% of the D level (28028).