Similar Price Action

This tool will find past sequences of candlestick patterns that are as similar as possible to an area of the chart you have selected.
The indicator will conduct a search starting right before the first candlestick of the price action region you have selected until the very first oldest bar of the chart.
There are several criteria for evaluating similarity between 2 sequences: 
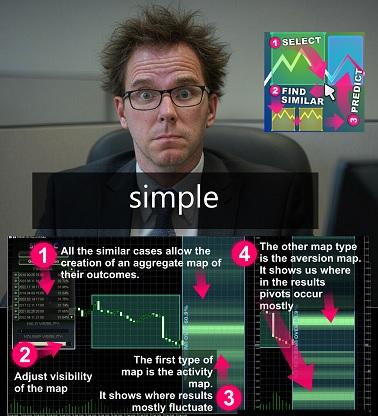
Great now you have the most similar activity to the current one . So what ? Well the tool also stores the outcomes of all the similar price action areas it found.
it can aggregate them all in sectors on a map , show you where most activity could probably be , show you where price tends to jump off of ,or if you prefer , you can inspect their direct resulting candles on the chart.
The video is more telling , it has no sound don't worry.
Below you may find 100% functional versions for EURUSD charts , for MT5 and MT4
Attached Image (click to enlarge)
This tool will find past sequences of candlestick patterns that are as similar as possible to an area of the chart you have selected.
The indicator will conduct a search starting right before the first candlestick of the price action region you have selected until the very first oldest bar of the chart.
There are several criteria for evaluating similarity between 2 sequences:
- Sequences must be identical in length , if your selected region is 20 candlesticks wide then any matching results will also have to be 20 candlesticks wide as well. You can select as many candles as you like.
- Sequences will be compared visually on their High to Low size
- Sequences will be compared visually on their Open to Close size and direction. If a candlestick bar is bullish for one sequence and bearish for the other , then the score is set to 0.0
- Sequences have a set of fast and slow moving averages which are compared on their delta. The delta can be compared relatively within that region or absolutely across the entire asset (relative and absolute modes)
- Sequences have a set of fast and slow ATRs to be compared for their volatility. Similarly the comparison can be relative or absolute.
- Sequences have a set of fast and slow RSIs to be compared for their local strength.
- All of the above are mixed for a final rating where each component is weighed by a coefficient. Coefficients and comparison methods are available in the indicator's inputs.
The indicator's search engine , simipac , will scan every possible candlestick sequence in the past without breaking the order of the candles.
The best of these sequences will be retained for you to inspect. You can adjust how many sequences are retained in the results table from the input screen.
Attached Image (click to enlarge)
Great now you have the most similar activity to the current one . So what ? Well the tool also stores the outcomes of all the similar price action areas it found.
it can aggregate them all in sectors on a map , show you where most activity could probably be , show you where price tends to jump off of ,or if you prefer , you can inspect their direct resulting candles on the chart.
The video is more telling , it has no sound don't worry.
Inserted Video
Below you may find 100% functional versions for EURUSD charts , for MT5 and MT4
Attached File(s)
Attached File(s)