DislikedHi, i am looking for an indicator or template that shows the name of the currency pair at the center of the chartIgnored
Attached File(s)
I don't know mql4
I will code your pivot EAs for no charge 28 replies
I will code your scalping EAs for no charge 163 replies
Oanda MT4 - Indicators and EAs not showing 2 replies
EAs and indicators relating to moutaki... 22 replies
InterbankFX has loaded its MT4 platform with custom EAs, indicators and scripts 1 reply
DislikedHi, i am looking for an indicator or template that shows the name of the currency pair at the center of the chartIgnored
Disliked{quote} The coder you mention couldn't code it because you are asking for something which doesn't make sense and can't be coded. The RSI indicator in separate window returns values between 0 and 100. The standard Envelopes are based on the main chart quotations, which are changing prices, not a fixed range. So, in the image you pointed to, which was posted by me, the Envelopes were applied to the RSI values, and that can be done. You can plot the Envelopes indicator in a separate window, but then the window scale will be the prices of the instrument...Ignored


DislikedHi my Friends, I need a help with an EA, If i put a trade X lot in a pair and i need to make $1 in the trade. After it gain $1 profit then it should automatically trail it to breake even .once it goes to $2 then it should trail it to $1,after $1 profit then it should automatically trail the profit to every $1 I want to move the stop loss to breakeven after a $1 profit, and then trail the stop loss at every $1 profit after that (e.g., $2 profit moves the SL to $1, $3 moves it to $2, and so on). Once the trade hits a $1 profit, we move the stop loss...Ignored
// Expected Behavior:
// 1. The EA is attached to a chart (e.g., EURUSD, H1).
// 2. Initially, no trade is managed (ticketNumber = -1), and the EA waits.
// 3. The trader manually opens a BUY trade at 1.20000 with a lot size of 0.1.
// 4. The EA detects the trade, assigns its ticket to ticketNumber, and:
//    - Calculates ATR (e.g., 0.0010), multiplies by 1.5 = 0.0015.
//    - Sets initial SL at 1.19850 (1.20000 - 0.0015).
//    - Prints: "Managing manual trade [ticket] with initial SL at 1.19850".
// 5. As profit increases:
//    - At $1.00 USD profit, SL moves to 1.20000 (breakeven).
//    - At $2.00 USD, SL trails to 1.20010 (assuming 10 points = $1.00 for 0.1 lots).
//    - At $3.00 USD, SL trails to 1.20020, locking in $2.00 profit if hit.
// 6. If the trade closes (SL hit or manual close), ticketNumber resets to -1,
//    and the EA waits for the next manual trade.
//+------------------------------------------------------------------+
DislikedOk, perhaps you can try to code this below easy idea. 1st step; timeframe=H1 any pairs sell entry when 24 bars consecutively having psar>=iOpen buy entry when 24bars consecutively having psar<=iOpen tp=50; sl=50; one trade per time if you done this, le me know....2nd step ideas laterIgnored

DislikedHello coders, how are you? Could you add the upper and lower level options to the inputs and color the indicator only when it is outside these levels? Thank you very much ;* {file} {image}Ignored
Disliked{quote} ohh i see what are you trying to say, we cannot use static (in range) indicator and dynamic indicator into a same window scale and the setup is just a illusion. Got it mate. Mate if you remember then before 2 or 3 days you send me link of a indicator and EA. in that can you add a dashboard which shows 1). total buy signal generated. 2). total sell signal generated. 3). total buy signal pip count. 4). total sell signal pip count. and if possible then i want to make that indicator an simple ea. the link you provided does have EA but it is...Ignored
Disliked{quote} Is anyone working on this? Please Let me know is it possible to code, will anyone here will help me get this done...!!!Ignored
DislikedGood day. I use the same indicator twice on the same chart. One with a daily setting, the other with a weekly setting. On the daily indicator, the period start shift (-10 hours) is successfully set up. On the weekly indicator, this setting does not work. If this is possible, please fix it. If not, please report it. Thank you.{image} {file}Ignored
input string UniqueID = "WyattsPivots"; // Unique ID for multi-instance support
QuoteDislikedTo use multiple instances of this indicator on the same chart without graphical conflicts, assign a unique text string to the UniqueID input parameter for each instance, for example, changing it from "WyattsPivots" to "WyattsPivots_Instance2" for a second copy.
/*--------------------------------------------------------------------
Change-log: WyattsPivots_v2.2 UniqueID
Date: 22-02-2024
By: MwlRCT
--------------------------------------------------------------------
- Added 'UniqueID' input parameter to enable running multiple instances of the indicator on the same chart without object name conflicts.
- Modified object naming convention in 'LevelsDraw' and 'LevelsDelete' functions to prepend the 'MMS_UniqueID' to all created object names.
- Updated 'OnInit' function to include 'MMS_UniqueID' in the button object name for consistency.
--------------------------------------------------------------------*/
//## MQL4/MQL5 Problem Solving & Implementation Guide - GENERATED CODE
//--------------------------------------------------------------------
// Program Name: WyattsPivots.mq4
// Description: This program will plot pivot levels on the chart and
// may send push notifications on levels reached. This
// program may be called multiple times on a chart to plot
// multiple time periods.
//
//--------------------------------------------------------------------
// Rev Date Programmer Changes
// 2.0 06/14/18 L. Garcia - Started out with program called WyattsPivots_erikmod.mq4
// - Added minor comments and code style (minimized global variable use)
// - Removed fibo pivots functionality
// - Removed previous OHLC functionality
// - Added chart digits instead of hardcoding to 4 decimal places on pivot price plots
// - Added period string to pivot label plots
// - Added '_' to shift on object names
// - Updated weekly trendline to stop on Friday instead of Saturday
// - Added push notifications to be sent by terminal
// 06/15/18 L. Garcia - Added "Not supported" alert if iTimePeriod parameter is set to Current
// - Added error checking to critical functions
// - Added notifications when price touches any pivot and/or midpoint levels
// 2.1 09/07/18 L. Garcia - Added time shift functionality for server GMT offset
// - Removed "Alert!" word from push notification string
// - Allow plot borders on future pivots if enabled
// - Allow re-send of push notification on failure
// - Renamed some input parameters for grouping/readability purposes
// - Added input parameter descriptions within code
// 2.2 10/27/23 Gehtsoft - Added UniqueID input parameter for multi-instance support
// - Modified object naming to include UniqueID to prevent conflicts
//--------------------------------------------------------------------
// List of acronyms used within expert logs and push notifications.
//
// R3: 3rd Resistance
// R2: 2nd Resistance
// R1: 1st Resistance
// PP: Pivot Point
// S1: 1st Support
// S2: 2nd Support
// S3: 3rd Support
// M5: Midpoint 5
// M4: Midpoint 4
// M3: Midpoint 3
// M2: Midpoint 2
// M1: Midpoint 1
// M0: Midpoint 0
// M1XX: Minute pivot levels
// M5XX: 5 minute pivot levels
// M15XX: 15 minute pivot levels
// M30XX: 30 minute pivot levels
// H1XX: 1 hour pivot levels
// H4XX: 4 hour pivot levels
// D1XX: Daily pivot levels
// W1XX: Weely pivot levels
// MN1XX: Montly pivot levels
// FXXXX: Future pivot levels
//--------------------------------------------------------------------
// Input parameter descriptions.
//
// iCountPeriods:
// The number of pivot periods to plot on the chart. Valid values
// include anything greater than 0.
// iTimePeriod:
// The time period used to plot pivot levels. Most common values
// include PERIOD_D1, PERIOD_W1, and PERIOD_MN1.
// iShiftHours:
// Specifies the GMT hour shift from the broker's daily close. This
// value is used in case the day needs to be shifted by a certain
// number of hours. Only daily pivots are affected by this value. Set
// the value to 0 if this feature is not desired. Valid values are
// between -14 and 12.
//
// iPlotPivots:
// Plots the current and history pivots to the chart.
// iPlotPivotFutures:
// Plots future pivots to the chart. Future pivots are calculated
// using price open/high/low for the current time period and are
// updated at every tick.
// iPlotPivotLabels:
// Plots the pivot level labels on the right side of the pivot line.
// Labels start with the specified time period and then the pivot name
// such as S1, M4, etc. An "F" in front of the label indicates a
// future pivot label.
// iPlotPivotPrices:
// Plots the pivot level price on the left side of the pivot line.
// Prices are shown to as many digits there are for the selected
// symbol.
// iPlotPivotStyles:
// Specifies the line style for the pivot level plots.
// iPlotPivotWidths:
// Specifies the line width for the pivot level plots.
// iPlotPivotColorRes:
// Specifies the line color for the resistance 1-3 pivot levels.
// iPlotPivotColorPP:
// Specifies the line color for the central pivot level.
// iPlotPivotColorSup:
// Specifies the line color for the support 1-3 pivot levels.
//
// iPlotMidpoints:
// Plots the current and history midpoint levels to the chart.
// iPlotMidpointStyles:
// Specifies the line style for the midpoint level plots.
// iPlotMidpointWidths:
// Specifies the line width for the midpoint level plots.
// iPlotMidpointColorM35:
// Specifies the line color for the midpoint 3-5 levels.
// iPlotMidpointColorM02:
// Specifies the line color for the midpoint 0-2 levels.
//
// iPlotZones:
// Plots the current and history buy/sell zones to the chart.
// The buy zone is plotted between M1 and S2. The sell zone is
// plotted between M4 and R2.
// iPlotBuyZoneColor:
// Specifies the buy zone color.
// iPlotSellZoneColor:
// Specifies the sell zone color.
//
// iPlotBorders:
// Plots the current and history left/right borders to the chart.
// Borders identify the start/end bars for the time period.
// iPlotBorderStyles:
// Specifies the line style for the border plots.
// iPlotBorderWidths:
// Specifies the line width for the border plots.
// iPlotBorderColors:
// Specifies the line color for the border plots.
//
// iPushNotifications_AllPivotsMidpoints:
// Sends all pivot and midpoint calculations to mobile terminal
// whenever they are available.
// iPushNotifications_TouchPP:
// Sends notification whenever price touches the central pivot point.
// iPushNotifications_TouchR1S1:
// Sends notification whenever price touches the R1 or S1 pivot levels.
// iPushNotifications_TouchR2S2:
// Sends notification whenever price touches the R2 or S2 pivot levels.
// iPushNotifications_TouchR3S3:
// Sends notification whenever price touches the R3 or S3 pivot levels.
// iPushNotifications_TouchM2M3:
// Sends notification whenever price touches the M2 or M3 pivot levels.
// iPushNotifications_TouchM1M4:
// Sends notification whenever price touches the M1 or M4 pivot levels.
// iPushNotifications_TouchM0M5:
// Sends notification whenever price touches the M0 or M5 pivot levels.
// iPushNotifications_TouchToleranceInDigits:
// Specifies the tolerance in chart digits for the above price touches.
// The notification will be sent when price gets close to the pivot
// level. This value is in positive chart digits. For example, if the
// symbol is a 5 digit chart and you want to specify a 2 pip tolerance,
// then this value needs to be set to 20 because of the extra digit of
// the terminal. This value may be set to zero, if desired. Once the
// price alert is sent, the program will not send another notification
// until price touches a different level or the program is reloaded.
//
// UniqueID:
// A unique identifier for the indicator instance. Required for running
// multiple instances of this indicator on the same chart without
// object naming conflicts. Change this value for each instance.
//
// NOTE on push notifications: The system only allows for 2 notifications
// to be sent every second and a max of 10 notifications per minute.
// In case the notification fails to be sent then the program will
// try again a few seconds later. This feature may be disabled by MT4 if
// abused.
//--------------------------------------------------------------------
#property indicator_chart_window
#property indicator_buffers 0
// external inputs
extern int iCountPeriods = 2; // Number of pivot periods to plot
extern ENUM_TIMEFRAMES iTimePeriod = PERIOD_D1; // Time period for pivot calculation
extern int iShiftHours = -10; // GMT hour shift for daily pivots (-14 to 12)
extern string UniqueID = "WyattsPivots"; // Unique ID for multi-instance support
extern bool iPlotPivots = true; // Enable plotting of pivot levels
extern bool iPlotPivotFutures = true; // Enable plotting of future pivot levels
extern bool iPlotPivotLabels = true; // Enable plotting of pivot level labels
extern bool iPlotPivotPrices = true; // Enable plotting of pivot level prices
extern ENUM_LINE_STYLE iPlotPivotStyles = STYLE_SOLID; // Line style for pivot levels
extern int iPlotPivotWidths = 2; // Line width for pivot levels
extern color iPlotPivotColorRes = clrRed; // Color for resistance levels
extern color iPlotPivotColorPP = clrBlack; // Color for pivot point level
extern color iPlotPivotColorSup = clrGreen; // Color for support levels
extern bool iPlotMidpoints = true; // Enable plotting of midpoint levels
extern ENUM_LINE_STYLE iPlotMidpointStyles = STYLE_DASH; // Line style for midpoint levels
extern int iPlotMidpointWidths = 1; // Line width for midpoint levels
extern color iPlotMidpointColorM35 = clrRed; // Color for midpoints M3-M5
extern color iPlotMidpointColorM02 = clrGreen; // Color for midpoints M0-M2
extern bool iPlotZones = true; // Enable plotting of buy/sell zones
extern color iPlotBuyZoneColor = clrLightSeaGreen; // Color for buy zone
extern color iPlotSellZoneColor = clrLightSalmon; // Color for sell zone
extern bool iPlotBorders = false; // Enable plotting of period borders
extern ENUM_LINE_STYLE iPlotBorderStyles = STYLE_SOLID; // Line style for period borders
extern int iPlotBorderWidths = 1; // Line width for period borders
extern color iPlotBorderColors = clrBlack; // Color for period borders
extern bool iPushNotifications_AllPivotsMidpoints = false; // Enable push notifications for all pivots/midpoints
extern bool iPushNotifications_TouchPP = false; // Enable push notifications for PP touch
extern bool iPushNotifications_TouchR1S1 = false; // Enable push notifications for R1/S1 touch
extern bool iPushNotifications_TouchR2S2 = false; // Enable push notifications for R2/S2 touch
extern bool iPushNotifications_TouchR3S3 = false; // Enable push notifications for R3/S3 touch
extern bool iPushNotifications_TouchM2M3 = false; // Enable push notifications for M2/M3 touch
extern bool iPushNotifications_TouchM1M4 = false; // Enable push notifications for M1/M4 touch
extern bool iPushNotifications_TouchM0M5 = false; // Enable push notifications for M0/M5 touch
extern int iPushNotifications_TouchToleranceInDigits = 20; // Tolerance in digits for touch notifications
// constants
#define MAX_NUM_NOTIFICATION_QUEUE 10
#define MAX_TIMER_EVENT_ELAPSED_IN_SECS 10
// global variables
string gPeriod = "";
int gRealTimePeriod = 0;
datetime gPrevTimePivot = 0;
double gPrevTouchPrice = 0.0;
double gTouchToleranceDecimal = 0.0;
int gNumNotificationQueue = 0;
string gNotificationQueue[MAX_NUM_NOTIFICATION_QUEUE] = {NULL};
// Template code for button - START
extern string button_note1 = "------------------------------";
extern ENUM_BASE_CORNER btn_corner = CORNER_LEFT_UPPER; // chart btn_corner for anchoring
extern string btn_text = "Pivot";
extern string btn_Font = "Arial";
extern int btn_FontSize = 10; //btn__font size
extern color btn_text_ON_color = clrWhite;
extern color btn_text_OFF_color = clrRed;
extern color btn_background_color = clrDimGray;
extern color btn_border_color = clrBlack;
extern int button_x = 20; //btn__x
extern int button_y = 13; //btn__y
extern int btn_Width = 60; //btn__width
extern int btn_Height = 20; //btn__height
extern string button_note2 = "------------------------------";
bool show_data = true;
string IndicatorName, IndicatorObjPrefix;
string buttonId;
bool recalc = true;
// Template code for button - END
//+------------------------------------------------------------------------------------------------------------------+
string GenerateIndicatorName(const string target) //don't change anything here
{
string name = target;
int try = 2;
while (WindowFind(name) != -1)
{
name = target + " #" + IntegerToString(try++);
}
return name;
}
//+------------------------------------------------------------------------------------------------------------------+
int OnInit()
{
IndicatorName = GenerateIndicatorName(btn_text);
IndicatorObjPrefix = "__" + IndicatorName + "__";
IndicatorShortName(IndicatorName);
IndicatorDigits(Digits);
double val;
if (GlobalVariableGet(IndicatorName + "_visibility", val))
show_data = val != 0;
ChartSetInteger(ChartID(), CHART_EVENT_MOUSE_MOVE, 1);
buttonId = IndicatorObjPrefix + UniqueID + "_WyattsPivots2020"; // Include UniqueID in button name
createButton(buttonId, btn_text, btn_Width, btn_Height, btn_Font, btn_FontSize, btn_background_color, btn_border_color, btn_text_ON_color);
ObjectSetInteger(ChartID(), buttonId, OBJPROP_YDISTANCE, button_y);
ObjectSetInteger(ChartID(), buttonId, OBJPROP_XDISTANCE, button_x);
// put init() here
init2();
return(INIT_SUCCEEDED);
}
//+------------------------------------------------------------------------------------------------------------------+
//don't change anything here
void createButton(string buttonID,string buttonText,int width,int height,string font,int fontSize,color bgColor,color borderColor,color txtColor)
{
ObjectDelete (ChartID(),buttonID);
ObjectCreate (ChartID(),buttonID,OBJ_BUTTON,0,0,0);
ObjectSetInteger(ChartID(),buttonID,OBJPROP_COLOR,txtColor);
ObjectSetInteger(ChartID(),buttonID,OBJPROP_BGCOLOR,bgColor);
ObjectSetInteger(ChartID(),buttonID,OBJPROP_BORDER_COLOR,borderColor);
ObjectSetInteger(ChartID(),buttonID,OBJPROP_XSIZE,width);
ObjectSetInteger(ChartID(),buttonID,OBJPROP_YSIZE,height);
ObjectSetString (ChartID(),buttonID,OBJPROP_FONT,font);
ObjectSetString (ChartID(),buttonID,OBJPROP_TEXT,buttonText);
ObjectSetInteger(ChartID(),buttonID,OBJPROP_FONTSIZE,fontSize);
ObjectSetInteger(ChartID(),buttonID,OBJPROP_SELECTABLE,0);
ObjectSetInteger(ChartID(),buttonID,OBJPROP_CORNER,btn_corner);
ObjectSetInteger(ChartID(),buttonID,OBJPROP_HIDDEN,1);
ObjectSetInteger(ChartID(),buttonID,OBJPROP_XDISTANCE,9999);
ObjectSetInteger(ChartID(),buttonID,OBJPROP_YDISTANCE,9999);
}
//+------------------------------------------------------------------------------------------------------------------+
int deinit()
{
ObjectsDeleteAll(ChartID(), IndicatorObjPrefix);
//put deinit() here
deinit2();
return(0);
}
//+------------------------------------------------------------------------------------------------------------------+
//don't change anything here
void handleButtonClicks()
{
if (ObjectGetInteger(ChartID(), buttonId, OBJPROP_STATE))
{
ObjectSetInteger(ChartID(), buttonId, OBJPROP_STATE, false);
show_data = !show_data;
GlobalVariableSet(IndicatorName + "_visibility", show_data ? 1.0 : 0.0);
recalc = true;
start();
}
}
//+------------------------------------------------------------------------------------------------------------------+
void OnChartEvent(const int id, //don't change anything here
const long &lparam,
const double &dparam,
const string &sparam)
{
handleButtonClicks();
}
//+------------------------------------------------------------------------------------------------------------------+
int start()
{
handleButtonClicks();
recalc = false;
//put start () here
start2();
if (show_data)
{
ObjectSetInteger(ChartID(),buttonId,OBJPROP_COLOR,btn_text_ON_color);
}
else
{
ObjectSetInteger(ChartID(),buttonId,OBJPROP_COLOR,btn_text_OFF_color);
deinit2();
}
return(0);
}
//+------------------------------------------------------------------------------------------------------------------+
//+------------------------------------------------------------------+
// init - This function will set the period string and real time. The
// period string is used on label plots and object names. The real
// time period is used to plot correct time lenghts on higher
// timeframes.
//+------------------------------------------------------------------+
int init2()
{
int error = 0;
int timerVal = 0;
// calculate decimal prices according to digits
gTouchToleranceDecimal = iPushNotifications_TouchToleranceInDigits / MathPow(10, Digits);
// go through each timeframe and assign period string and real time period minutes
// NOTE: real minutes are used to calculate end times and future times
switch (iTimePeriod)
{
case PERIOD_M1:
gPeriod = "M1";
gRealTimePeriod = PERIOD_M1; // 1 minute
break;
case PERIOD_M5:
gPeriod = "M5";
gRealTimePeriod = PERIOD_M5; // 5 minutes
break;
case PERIOD_M15:
gPeriod = "M15";
gRealTimePeriod = PERIOD_M15; // 15 minutes
break;
case PERIOD_M30:
gPeriod = "M30";
gRealTimePeriod = PERIOD_M30; // 30 minutes
break;
case PERIOD_H1:
gPeriod = "H1";
gRealTimePeriod = PERIOD_H1; // 60 minutes
break;
case PERIOD_H4:
gPeriod = "H4";
gRealTimePeriod = PERIOD_H4; // 240 minutes
break;
case PERIOD_D1:
gPeriod = "D1";
gRealTimePeriod = PERIOD_D1; // 1440 minutes
break;
case PERIOD_W1:
gPeriod = "W1";
gRealTimePeriod = 8640; // 8640 minutes (update to draw weekly line for 6 days only)
break;
case PERIOD_MN1:
gPeriod = "MN1";
gRealTimePeriod = PERIOD_MN1; // 43200 minutes (30 days)
break;
default:
gPeriod = "";
Alert("iTimePeriod param specified is not supported.");
break;
}
// check if shift hours is used and within GMT range (GMT-12 through GMT+14)
if (iShiftHours > 12 || iShiftHours < -14)
{
Alert("iShiftHours param specified is out-of-range. Valid values are between -14 and 12. Re-setting to 0.");
iShiftHours = 0;
}
// create random timer value between 1 and MAX defined
MathSrand(GetTickCount());
timerVal = MathRand() % MAX_TIMER_EVENT_ELAPSED_IN_SECS;
if (timerVal <= 0)
{
timerVal = MAX_TIMER_EVENT_ELAPSED_IN_SECS;
}
// troubleshooting log
//Print("timerVal: ", IntegerToString(timerVal));
// start timer event handler
if (EventSetTimer(timerVal) == false)
{
// print error to log
error = GetLastError();
Print("<= Error starting timer event handler => ", error);
}
return(0);
}
//+------------------------------------------------------------------+
// deinit - This function will delete all objects on the chart.
//+------------------------------------------------------------------+
int deinit2()
{
// delete all objects and remove timer event handler
DeleteAllObjects();
EventKillTimer();
return(0);
}
//+------------------------------------------------------------------+
// OnTimer - This timer event handler will resend push notifications
// in case of a frequency violation. According to MT4, no more than
// 2 notifications per second or 10 notifications per minute. This
// function will try sending again on every second elapsed.
// In the event that the queue gets maxed out this function will
// flush all queued notifications.
//+------------------------------------------------------------------+
void OnTimer()
{
int error = 0;
int i = 0;
// check if notification queue is not empty
if (gNumNotificationQueue > 0 && gNumNotificationQueue < MAX_NUM_NOTIFICATION_QUEUE)
{
// loop through all queued notifications and try to send them
for (i = 0; i < gNumNotificationQueue; i++)
{
// check if string queue is not empty
if (StringLen(gNotificationQueue[i]) > 0)
{
// send notification and check for error
if (SendNotification(gNotificationQueue[i]) == false)
{
// print error to log and exit (possibly too frequent)
error = GetLastError();
Print("<= Error sending notification => ", error);
return;
}
else
{
// notification was sent successfully... clear string buffer and exit
// NOTE: will send the next notification on the next timer elapsed
gNotificationQueue[i] = "";
return;
}
}
} // end of notification queue (for loop)
// check if sending all notifications was a success and reset queue num
if (error == 0)
{
gNumNotificationQueue = 0;
}
} // end of notification buffer check (if statement)
else if (gNumNotificationQueue >= MAX_NUM_NOTIFICATION_QUEUE)
{
// queue buffer is maxed out and terminal cannot keep up... flush buffer to start over
for (i = 0; i < gNumNotificationQueue; i++)
{
gNotificationQueue[i] = "";
}
gNumNotificationQueue = 0;
}
return;
}
//+------------------------------------------------------------------+
// start - This function will calculate the start/end times for the
// objects on the specified timeframe and draw the pivots for all
// history counts and future pivots.
//+------------------------------------------------------------------+
int start2()
{
int error = 0;
int shift = 0;
int startBarShift = 0;
int endBarShift = 0;
datetime timeStartObj;
datetime timeEndObj;
// remove all objects upon entry
DeleteAllObjects();
// draw current and history pivots/midpoints
if (iPlotPivots && iTimePeriod != 0)
{
for (shift = 0; shift < iCountPeriods; shift++)
{
// clear loop variables
error = 0;
// calculate start/end times for current/previous objects
// NOTE: check if daily period was selected and hour shift is used
if (iTimePeriod == PERIOD_D1 && iShiftHours != 0)
{
// NOTE: start/end shift times for objects are used only
error = GetShiftInfo(shift, startBarShift, endBarShift, timeStartObj, timeEndObj);
}
else
{
timeStartObj = iTime(NULL, iTimePeriod, shift);
timeEndObj = iTime(NULL, iTimePeriod, shift) + (gRealTimePeriod * 60);
}
// check for valid values and draw levels
if (error == 0)
{
// NOTE: increment function shift since previous bar is used to calculate current bar's pivots
LevelsDraw(shift + 1, timeStartObj, timeEndObj, gPeriod, false);
}
}
}
// draw future pivots/midpoints
if (iPlotPivotFutures && iTimePeriod != 0)
{
// calculate start/end times for future objects
// NOTE: check if daily period was selected and hour shift is used
if (iTimePeriod == PERIOD_D1 && iShiftHours != 0)
{
// NOTE: start/end shift times for objects are used only
error = GetShiftInfo(0, startBarShift, endBarShift, timeStartObj, timeEndObj);
// add another day (shift) to calculate both start/end shifted times for future calculations
timeStartObj = timeEndObj;
timeEndObj = timeStartObj + (gRealTimePeriod * 60);
}
else
{
timeStartObj = iTime(NULL, iTimePeriod, 0) + (gRealTimePeriod * 60);
timeEndObj = iTime(NULL, iTimePeriod, 0) + (gRealTimePeriod * 120);
}
// troubleshooting log
//Print(" timeStartObj: ", IntegerToString(timeStartObj), " timeEndObj: ", IntegerToString(timeEndObj));
// NOTE: current bar (shift = 0) is used to calculate future pivots
LevelsDraw(0, timeStartObj, timeEndObj, "F" + gPeriod, true);
}
// send push notifications to terminal
if (iTimePeriod != 0)
{
SendPushNotifications();
}
return(0);
}
//+------------------------------------------------------------------+
// SendPushNotifications - This function will calculate the current
// period's pivot points and send them as push notifications to the
// terminal.
//+------------------------------------------------------------------+
int SendPushNotifications(void)
{
int error = 0;
double pivP = 0.0;
double res1 = 0.0;
double res2 = 0.0;
double res3 = 0.0;
double sup1 = 0.0;
double sup2 = 0.0;
double sup3 = 0.0;
double mid0 = 0.0;
double mid1 = 0.0;
double mid2 = 0.0;
double mid3 = 0.0;
double mid4 = 0.0;
double mid5 = 0.0;
string msg = "";
string pivMsg = "";
string midMsg = "";
int startBarShift = 0;
int endBarShift = 0;
datetime currBarTime = 0;
datetime endTimeShift = 0;
double currBarPrice = 0.0;
if (iTimePeriod == PERIOD_D1 && iShiftHours != 0)
{
// NOTE: only the start time shift is used in this function
error = GetShiftInfo(0, startBarShift, endBarShift, currBarTime, endTimeShift);
}
else
{
// get the current bar time and check for error
currBarTime = iTime(NULL, iTimePeriod, 0);
if (currBarTime == 0)
{
// print error to log and exit function
error = GetLastError();
Print("<= Error getting current bar time => ", error);
return error;
}
}
// get the current bid price and check for error
currBarPrice = Bid;
if (currBarPrice == 0)
{
// print error to log and exit function
error = GetLastError();
Print("<= Error getting current bid price => ", error);
return error;
}
// get pivot points and midpoint levels for current period (shift = 1)
error = GetPivotPoints(iTimePeriod, 1, pivP, res1, res2, res3, sup1, sup2, sup3, mid0, mid1, mid2, mid3, mid4, mid5);
if (error != 0)
{
return error;
}
// create pivots message if enabled
if (iPlotPivots)
{
pivMsg = StringConcatenate(
", ", gPeriod, "R3: ", DoubleToStr(res3, Digits),
", ", gPeriod, "R2: ", DoubleToStr(res2, Digits),
", ", gPeriod, "R1: ", DoubleToStr(res1, Digits),
", ", gPeriod, "PP: ", DoubleToStr(pivP, Digits),
", ", gPeriod, "S1: ", DoubleToStr(sup1, Digits),
", ", gPeriod, "S2: ", DoubleToStr(sup2, Digits),
", ", gPeriod, "S3: ", DoubleToStr(sup3, Digits));
}
// create midpoints message if enabled
if (iPlotMidpoints)
{
midMsg = StringConcatenate(
", ", gPeriod, "M5: ", DoubleToStr(mid5, Digits),
", ", gPeriod, "M4: ", DoubleToStr(mid4, Digits),
", ", gPeriod, "M3: ", DoubleToStr(mid3, Digits),
", ", gPeriod, "M2: ", DoubleToStr(mid2, Digits),
", ", gPeriod, "M1: ", DoubleToStr(mid1, Digits),
", ", gPeriod, "M0: ", DoubleToStr(mid0, Digits));
}
// check for push notifications enabled
if (iPushNotifications_AllPivotsMidpoints == true &&
(gPrevTimePivot == 0 || gPrevTimePivot != currBarTime)) // initial program start or a new time period has begun
{
// update prev time global to current period so we wont enter here again
gPrevTimePivot = currBarTime;
// add push notification to queue and print msg to log
Print(Symbol() + pivMsg + midMsg);
if (gNumNotificationQueue < MAX_NUM_NOTIFICATION_QUEUE)
{
gNotificationQueue[gNumNotificationQueue] = StringConcatenate(Symbol() + pivMsg + midMsg);
gNumNotificationQueue++;
}
}
// check/send pivot point touches
SendPushNotifications_Touch(iPushNotifications_TouchPP, "PP", pivP, currBarPrice);
SendPushNotifications_Touch(iPushNotifications_TouchR1S1, "R1", res1, currBarPrice);
SendPushNotifications_Touch(iPushNotifications_TouchR1S1, "S1", sup1, currBarPrice);
SendPushNotifications_Touch(iPushNotifications_TouchR2S2, "R2", res2, currBarPrice);
SendPushNotifications_Touch(iPushNotifications_TouchR2S2, "S2", sup2, currBarPrice);
SendPushNotifications_Touch(iPushNotifications_TouchR3S3, "R3", res3, currBarPrice);
SendPushNotifications_Touch(iPushNotifications_TouchR3S3, "S3", sup3, currBarPrice);
// check/send midpoint touches
SendPushNotifications_Touch(iPushNotifications_TouchM2M3, "M2", mid2, currBarPrice);
SendPushNotifications_Touch(iPushNotifications_TouchM2M3, "M3", mid3, currBarPrice);
SendPushNotifications_Touch(iPushNotifications_TouchM1M4, "M1", mid1, currBarPrice);
SendPushNotifications_Touch(iPushNotifications_TouchM1M4, "M4", mid4, currBarPrice);
SendPushNotifications_Touch(iPushNotifications_TouchM0M5, "M0", mid0, currBarPrice);
SendPushNotifications_Touch(iPushNotifications_TouchM0M5, "M5", mid5, currBarPrice);
return error;
}
//+------------------------------------------------------------------+
// SendPushNotifications_Touch - This function will check if the touch
// feature is enabled and calculate if the current price is near
// the target price in order to send a price alert as a push
// notification to the terminal. The function will also check if
// the notification has already been sent to avoid multiple sends.
//
// Returns: 0 = not sent; 1 = was sent.
//+------------------------------------------------------------------+
int SendPushNotifications_Touch( bool FeatureEnabled,
string LevelStr,
double TargetPrice,
double CurrBarPrice)
{
int sent = 0;
string msg = "";
// check if previous touch price has been initialized
// NOTE: happens during initial program load or system reset
if (gPrevTouchPrice < 0.0000001)
{
gPrevTouchPrice = CurrBarPrice;
}
// check if feature is enabled and at target price
if (FeatureEnabled == true &&
MathAbs(TargetPrice - gPrevTouchPrice) > 0.0000001 && // price has not already touched before (double compare)
(MathAbs(TargetPrice - CurrBarPrice) <= gTouchToleranceDecimal || // current price is close to target price -or-
(gPrevTouchPrice < TargetPrice && TargetPrice < CurrBarPrice) || // target price is between last touch and current price (gaps)
(gPrevTouchPrice > TargetPrice && TargetPrice > CurrBarPrice)))
{
// update prev touch price global to target price so we wont enter here again
gPrevTouchPrice = TargetPrice;
// add push notification to queue and print msg to log
msg = StringConcatenate(Symbol(), ", Price touched ", gPeriod, LevelStr, " at ", DoubleToStr(TargetPrice, Digits));
Print(msg);
if (gNumNotificationQueue < MAX_NUM_NOTIFICATION_QUEUE)
{
gNotificationQueue[gNumNotificationQueue] = StringConcatenate(msg);
gNumNotificationQueue++;
}
// set notification sent return variable
sent = 1;
}
return sent;
}
//+------------------------------------------------------------------+
// LevelsDraw - This function will get the pivot levels for the
// specified timeframe and plot them to the chart using the
// specified start/end times for all chart objects.
//+------------------------------------------------------------------+
int LevelsDraw( int Shift,
datetime TimeStartObj,
datetime TimeEndObj,
string PeriodStr,
bool IsFuture)
{
int error = 0;
double pivP = 0.0; // Pivot Levels
double res1 = 0.0;
double res2 = 0.0;
double res3 = 0.0;
double sup1 = 0.0;
double sup2 = 0.0;
double sup3 = 0.0;
double mid0 = 0.0;
double mid1 = 0.0;
double mid2 = 0.0;
double mid3 = 0.0;
double mid4 = 0.0;
double mid5 = 0.0;
// get pivot points and midpoint levels
error = GetPivotPoints(iTimePeriod, Shift, pivP, res1, res2, res3, sup1, sup2, sup3, mid0, mid1, mid2, mid3, mid4, mid5);
if (error != 0)
{
return error;
}
string uniquePrefix = UniqueID + "_"; // Create a unique prefix for object names
// plot zones if enabled
if (iPlotZones)
{
PlotRectangle(0, uniquePrefix + PeriodStr + "BZ_" + Shift, 0, TimeStartObj, mid1, TimeEndObj, sup2, iPlotBuyZoneColor);
PlotRectangle(0, uniquePrefix + PeriodStr + "SZ_" + Shift, 0, TimeStartObj, mid4, TimeEndObj, res2, iPlotSellZoneColor);
}
// plot pivots if enabled
if (iPlotPivots)
{
// plot trendline for pivot levels
PlotTrend(0, uniquePrefix + PeriodStr + "R3_T" + Shift, 0, TimeStartObj, res3, TimeEndObj, res3, iPlotPivotColorRes, iPlotPivotStyles, iPlotPivotWidths);
PlotTrend(0, uniquePrefix + PeriodStr + "R2_T" + Shift, 0, TimeStartObj, res2, TimeEndObj, res2, iPlotPivotColorRes, iPlotPivotStyles, iPlotPivotWidths);
PlotTrend(0, uniquePrefix + PeriodStr + "R1_T" + Shift, 0, TimeStartObj, res1, TimeEndObj, res1, iPlotPivotColorRes, iPlotPivotStyles, iPlotPivotWidths);
PlotTrend(0, uniquePrefix + PeriodStr + "PP_T" + Shift, 0, TimeStartObj, pivP, TimeEndObj, pivP, iPlotPivotColorPP, iPlotPivotStyles, iPlotPivotWidths);
PlotTrend(0, uniquePrefix + PeriodStr + "S1_T" + Shift, 0, TimeStartObj, sup1, TimeEndObj, sup1, iPlotPivotColorSup, iPlotPivotStyles, iPlotPivotWidths);
PlotTrend(0, uniquePrefix + PeriodStr + "S2_T" + Shift, 0, TimeStartObj, sup2, TimeEndObj, sup2, iPlotPivotColorSup, iPlotPivotStyles, iPlotPivotWidths);
PlotTrend(0, uniquePrefix + PeriodStr + "S3_T" + Shift, 0, TimeStartObj, sup3, TimeEndObj, sup3, iPlotPivotColorSup, iPlotPivotStyles, iPlotPivotWidths);
if (iPlotPivotLabels)
{
PlotText(0, uniquePrefix + PeriodStr + "R3_L" + Shift, 0, TimeEndObj, res3, PeriodStr + "R3", "Arial", 8, iPlotPivotColorRes, ANCHOR_RIGHT_UPPER);
PlotText(0, uniquePrefix + PeriodStr + "R2_L" + Shift, 0, TimeEndObj, res2, PeriodStr + "R2", "Arial", 8, iPlotPivotColorRes, ANCHOR_RIGHT_UPPER);
PlotText(0, uniquePrefix + PeriodStr + "R1_L" + Shift, 0, TimeEndObj, res1, PeriodStr + "R1", "Arial", 8, iPlotPivotColorRes, ANCHOR_RIGHT_UPPER);
PlotText(0, uniquePrefix + PeriodStr + "PP_L" + Shift, 0, TimeEndObj, pivP, PeriodStr + "PP", "Arial", 8, iPlotPivotColorPP, ANCHOR_RIGHT_UPPER);
PlotText(0, uniquePrefix + PeriodStr + "S1_L" + Shift, 0, TimeEndObj, sup1, PeriodStr + "S1", "Arial", 8, iPlotPivotColorSup, ANCHOR_RIGHT_UPPER);
PlotText(0, uniquePrefix + PeriodStr + "S2_L" + Shift, 0, TimeEndObj, sup2, PeriodStr + "S2", "Arial", 8, iPlotPivotColorSup, ANCHOR_RIGHT_UPPER);
PlotText(0, uniquePrefix + PeriodStr + "S3_L" + Shift, 0, TimeEndObj, sup3, PeriodStr + "S3", "Arial", 8, iPlotPivotColorSup, ANCHOR_RIGHT_UPPER);
}
if (iPlotPivotPrices)
{
PlotText(0, uniquePrefix + PeriodStr + "R3_P" + Shift, 0, TimeStartObj, res3, DoubleToString(res3, Digits), "Arial", 8, iPlotPivotColorRes, ANCHOR_LEFT_UPPER);
PlotText(0, uniquePrefix + PeriodStr + "R2_P" + Shift, 0, TimeStartObj, res2, DoubleToString(res2, Digits), "Arial", 8, iPlotPivotColorRes, ANCHOR_LEFT_UPPER);
PlotText(0, uniquePrefix + PeriodStr + "R1_P" + Shift, 0, TimeStartObj, res1, DoubleToString(res1, Digits), "Arial", 8, iPlotPivotColorRes, ANCHOR_LEFT_UPPER);
PlotText(0, uniquePrefix + PeriodStr + "PP_P" + Shift, 0, TimeStartObj, pivP, DoubleToString(pivP, Digits), "Arial", 8, iPlotPivotColorPP, ANCHOR_LEFT_UPPER);
PlotText(0, uniquePrefix + PeriodStr + "S1_P" + Shift, 0, TimeStartObj, sup1, DoubleToString(sup1, Digits), "Arial", 8, iPlotPivotColorSup, ANCHOR_LEFT_UPPER);
PlotText(0, uniquePrefix + PeriodStr + "S2_P" + Shift, 0, TimeStartObj, sup2, DoubleToString(sup2, Digits), "Arial", 8, iPlotPivotColorSup, ANCHOR_LEFT_UPPER);
PlotText(0, uniquePrefix + PeriodStr + "S3_P" + Shift, 0, TimeStartObj, sup3, DoubleToString(sup3, Digits), "Arial", 8, iPlotPivotColorSup, ANCHOR_LEFT_UPPER);
}
}
// plot midpoints if enabled
if (iPlotMidpoints)
{
// plot trendline for midpoint levels
PlotTrend(0, uniquePrefix + PeriodStr + "M0_T" + Shift, 0, TimeStartObj, mid0, TimeEndObj, mid0, iPlotMidpointColorM02, iPlotMidpointStyles, iPlotMidpointWidths);
PlotTrend(0, uniquePrefix + PeriodStr + "M1_T" + Shift, 0, TimeStartObj, mid1, TimeEndObj, mid1, iPlotMidpointColorM02, iPlotMidpointStyles, iPlotMidpointWidths);
PlotTrend(0, uniquePrefix + PeriodStr + "M2_T" + Shift, 0, TimeStartObj, mid2, TimeEndObj, mid2, iPlotMidpointColorM02, iPlotMidpointStyles, iPlotMidpointWidths);
PlotTrend(0, uniquePrefix + PeriodStr + "M3_T" + Shift, 0, TimeStartObj, mid3, TimeEndObj, mid3, iPlotMidpointColorM35, iPlotMidpointStyles, iPlotMidpointWidths);
PlotTrend(0, uniquePrefix + PeriodStr + "M4_T" + Shift, 0, TimeStartObj, mid4, TimeEndObj, mid4, iPlotMidpointColorM35, iPlotMidpointStyles, iPlotMidpointWidths);
PlotTrend(0, uniquePrefix + PeriodStr + "M5_T" + Shift, 0, TimeStartObj, mid5, TimeEndObj, mid5, iPlotMidpointColorM35, iPlotMidpointStyles, iPlotMidpointWidths);
if (iPlotPivotLabels)
{
PlotText(0, uniquePrefix + PeriodStr + "M0_L" + Shift, 0, TimeEndObj, mid0, PeriodStr + "M0", "Arial", 8, iPlotMidpointColorM02, ANCHOR_RIGHT_UPPER);
PlotText(0, uniquePrefix + PeriodStr + "M1_L" + Shift, 0, TimeEndObj, mid1, PeriodStr + "M1", "Arial", 8, iPlotMidpointColorM02, ANCHOR_RIGHT_UPPER);
PlotText(0, uniquePrefix + PeriodStr + "M2_L" + Shift, 0, TimeEndObj, mid2, PeriodStr + "M2", "Arial", 8, iPlotMidpointColorM02, ANCHOR_RIGHT_UPPER);
PlotText(0, uniquePrefix + PeriodStr + "M3_L" + Shift, 0, TimeEndObj, mid3, PeriodStr + "M3", "Arial", 8, iPlotMidpointColorM35, ANCHOR_RIGHT_UPPER);
PlotText(0, uniquePrefix + PeriodStr + "M4_L" + Shift, 0, TimeEndObj, mid4, PeriodStr + "M4", "Arial", 8, iPlotMidpointColorM35, ANCHOR_RIGHT_UPPER);
PlotText(0, uniquePrefix + PeriodStr + "M5_L" + Shift, 0, TimeEndObj, mid5, PeriodStr + "M5", "Arial", 8, iPlotMidpointColorM35, ANCHOR_RIGHT_UPPER);
}
if (iPlotPivotPrices)
{
PlotText(0, uniquePrefix + PeriodStr + "M0_P" + Shift, 0, TimeStartObj, mid0, DoubleToString(mid0, Digits), "Arial", 8, iPlotMidpointColorM02, ANCHOR_LEFT_UPPER);
PlotText(0, uniquePrefix + PeriodStr + "M1_P" + Shift, 0, TimeStartObj, mid1, DoubleToString(mid1, Digits), "Arial", 8, iPlotMidpointColorM02, ANCHOR_LEFT_UPPER);
PlotText(0, uniquePrefix + PeriodStr + "M2_P" + Shift, 0, TimeStartObj, mid2, DoubleToString(mid2, Digits), "Arial", 8, iPlotMidpointColorM02, ANCHOR_LEFT_UPPER);
PlotText(0, uniquePrefix + PeriodStr + "M3_P" + Shift, 0, TimeStartObj, mid3, DoubleToString(mid3, Digits), "Arial", 8, iPlotMidpointColorM35, ANCHOR_LEFT_UPPER);
PlotText(0, uniquePrefix + PeriodStr + "M4_P" + Shift, 0, TimeStartObj, mid4, DoubleToString(mid4, Digits), "Arial", 8, iPlotMidpointColorM35, ANCHOR_LEFT_UPPER);
PlotText(0, uniquePrefix + PeriodStr + "M5_P" + Shift, 0, TimeStartObj, mid5, DoubleToString(mid5, Digits), "Arial", 8, iPlotMidpointColorM35, ANCHOR_LEFT_UPPER);
}
}
// plot left/right borders if enabled
if (iPlotBorders)
{
PlotTrend(0, uniquePrefix + PeriodStr + "BDL_" + Shift, 0, TimeStartObj, res3, TimeStartObj, sup3, iPlotBorderColors, iPlotBorderStyles, iPlotBorderWidths);
PlotTrend(0, uniquePrefix + PeriodStr + "BDR_" + Shift, 0, TimeEndObj, res3, TimeEndObj, sup3, iPlotBorderColors, iPlotBorderStyles, iPlotBorderWidths);
}
return error;
}
//+------------------------------------------------------------------+
// GetShiftInfo - This function will calculate the start and end
// hourly bar and time shifts.
//+------------------------------------------------------------------+
int GetShiftInfo( int Shift,
int &StartBarShift,
int &EndBarShift,
datetime &StartTimeShift,
datetime &EndTimeShift)
{
int error = 0;
int ShiftedFlag = 0;
int tempBarShift = 0;
int DailyShift = Shift; // in case if modified
// reset params on entry
StartBarShift = -1;
EndBarShift = -1;
StartTimeShift = 0;
EndTimeShift = 0;
// first, calculate hourly shift for current day overlaps
tempBarShift = iBarShift(NULL, PERIOD_H1, iTime(NULL, PERIOD_D1, 0), false);
tempBarShift += iShiftHours;
// check if hourly shift is negative
// NOTE: this may happen on iShiftHours < 0 and day open is near
if (tempBarShift < 0)
{
// add a day shift for accurate pivot calculations and set shifted flag
DailyShift++;
ShiftedFlag = 1;
}
// check if hourly shift is over a day (24 hours)
// NOTE: this may happen on iShiftHours > 0 and day close is near
else if (/*iShiftHours > 0 && */tempBarShift > 24)
{
// subtract a day shift for accurate pivot calculations and set shifted flag
// NOTE: shift cannot be negative
if (DailyShift > 0)
{
DailyShift--;
}
ShiftedFlag = -1;
}
// get the shift for the start bar (shift in hours for the start of day)
StartBarShift = iBarShift(NULL, PERIOD_H1, iTime(NULL, PERIOD_D1, DailyShift), false);
StartBarShift += iShiftHours;
// check for valid start hourly bar shift (non-negative)
if (StartBarShift >= 0)
{
// get shifted start time and check if valid (greater than zero)
StartTimeShift = iTime(NULL, PERIOD_H1, StartBarShift);
if (StartTimeShift > 0)
{
// check for current/future shift calculation
if (DailyShift > 0)
{
// get the shift for the end bar (shift in hours for the end of day)
// NOTE: end bar shift should be 1 hour before the end of day for accurate pivot calculations (day close = last hour close)
EndBarShift = iBarShift(NULL, PERIOD_H1, iTime(NULL, PERIOD_D1, DailyShift - 1), false);
EndBarShift += iShiftHours + 1;
}
else
{
// get the shift for the end bar (shift in hours for the end of day)
// NOTE: end bar shift should be 1 hour before the end of day for accurate pivot calculations (day close = last hour close)
// NOTE: use the current daily shift instead (= 0, same as start) and shift hours right
EndBarShift = iBarShift(NULL, PERIOD_H1, iTime(NULL, PERIOD_D1, DailyShift), false);
EndBarShift -= 24 - iShiftHours - 1;
}
// check for valid end hourly bar shift (non-negative)
if (EndBarShift > 0)
{
// get shifted end time
// NOTE: add another hourly bar (1 less shift) so that there won't be any gaps in the lines
EndTimeShift = iTime(NULL, PERIOD_H1, EndBarShift - 1);
}
else
{
// use current bar for end shift and calculate end time by adding a day to the shifted start time
// NOTE: use the latest bar's time in case of weekend gaps, then add whatever hours are left
EndBarShift = 0;
EndTimeShift = iTime(NULL, PERIOD_H1, 0) + (MathAbs(StartBarShift - 24) * 60 * 60);
}
// check for accurate start/end calculations
// NOTE: this may happen on initial day and if day was shifted
if (Shift == 0 && ShiftedFlag == -1)
{
// update start/end params
StartTimeShift = EndTimeShift;
StartBarShift = iBarShift(NULL, PERIOD_H1, StartTimeShift, false);
EndBarShift = 0;
EndTimeShift = iTime(NULL, PERIOD_H1, 0) + (MathAbs(StartBarShift - 24) * 60 * 60);
}
}
}
// check for valid params on exit
if (StartBarShift < 0 || EndBarShift < 0 ||
StartTimeShift <= 0 || EndTimeShift <= 0)
{
error = -1;
}
// troubleshooting log
//Print("Shift: ", IntegerToString(Shift), " DailyShift: ", IntegerToString(DailyShift),
// " ShiftedFlag: ", IntegerToString(ShiftedFlag), " error: ", IntegerToString(error),
// " SBS: ", IntegerToString(StartBarShift), " EBS: ", IntegerToString(EndBarShift),
// " Range (inclusive): ", IntegerToString(StartBarShift - EndBarShift + 1),
// " STS: ", IntegerToString(StartTimeShift), " ETS: ", IntegerToString(EndTimeShift));
return error;
}
//+------------------------------------------------------------------+
// GetPivotPoints - This function will calculate the pivot points and
// midpoint levels for the timeframe and shift specified. This
// function also checks if there is a GMT offset on the daily time
// frame and adjust the pivot calculations accordingly.
//+------------------------------------------------------------------+
int GetPivotPoints( int TimeFrame,
int Shift,
double &PP,
double &R1, double &R2, double &R3,
double &S1, double &S2, double &S3,
double &M0, double &M1, double &M2, double &M3, double &M4, double &M5)
{
int error = 0;
double barOpen = 0.0;
double barHigh = 0.0;
double barLow = 0.0;
double barClose = 0.0;
int startBarShift = 0;
int endBarShift = 0;
datetime startTimeShift = 0;
datetime endTimeShift = 0;
// clear output params on entry
PP = 0.0;
R1 = 0.0; R2 = 0.0; R3 = 0.0;
S1 = 0.0; S2 = 0.0; S3 = 0.0;
M0 = 0.0; M1 = 0.0; M2 = 0.0; M3 = 0.0; M4 = 0.0; M5 = 0.0;
// calculate daily bar start/end hourly shift for shifted hours
if (TimeFrame == PERIOD_D1 && iShiftHours != 0)
{
// get start/end bar shift info
// NOTE: time shift is not used in this function
GetShiftInfo(Shift, startBarShift, endBarShift, startTimeShift, endTimeShift);
}
// get bar open price and check for error
// NOTE: check for daily period and shift hours enabled
if (TimeFrame == PERIOD_D1 && iShiftHours != 0)
{
barOpen = iOpen(NULL, PERIOD_H1, startBarShift);
}
else
{
barOpen = iOpen(NULL, TimeFrame, Shift);
}
if (barOpen == 0)
{
// print error to log and exit function
error = GetLastError();
Print("<= Error getting current bar open => ", error);
return error;
}
// get bar close price and check for error
// NOTE: check for daily period and shift hours enabled
if (TimeFrame == PERIOD_D1 && iShiftHours != 0)
{
barClose = iClose(NULL, PERIOD_H1, endBarShift);
}
else
{
// NOTE: if shift = 0 then function returns current bar price
barClose = iClose(NULL, TimeFrame, Shift);
}
if (barClose == 0)
{
// print error to log and exit function
error = GetLastError();
Print("<= Error getting current bar close => ", error);
return error;
}
// get bar high price and check for error
// NOTE: check for daily period and shift hours enabled
if (TimeFrame == PERIOD_D1 && iShiftHours != 0)
{
// NOTE: iHighest function has an inclusive count
barHigh = iHigh(NULL, PERIOD_H1, iHighest(NULL, PERIOD_H1, MODE_HIGH, startBarShift - endBarShift + 1, endBarShift));
}
else
{
barHigh = iHigh(NULL, TimeFrame, Shift);
}
if (barHigh == 0)
{
// print error to log and exit function
error = GetLastError();
Print("<= Error getting current bar high => ", error);
return error;
}
// get bar low price and check for error
// NOTE: check for daily period and shift hours enabled
if (TimeFrame == PERIOD_D1 && iShiftHours != 0)
{
// NOTE: iLowest function has an inclusive count
barLow = iLow(NULL, PERIOD_H1, iLowest(NULL, PERIOD_H1, MODE_LOW, startBarShift - endBarShift + 1, endBarShift));
}
else
{
barLow = iLow(NULL, TimeFrame, Shift);
}
if (barLow == 0)
{
// print error to log and exit function
error = GetLastError();
Print("<= Error getting current bar low => ", error);
return error;
}
// calculate pivot point, resistance, and support prices
PP = (barHigh + barLow + barClose) / 3;
R1 = (2 * PP) - barLow;
S1 = (2 * PP) - barHigh;
R2 = PP + (barHigh - barLow);
S2 = PP - (barHigh - barLow);
R3 = barHigh + (2 * (PP - barLow));
S3 = barLow - (2 * (barHigh - PP));
// calculate midpoint prices
M0 = 0.5 * (S2 + S3);
M1 = 0.5 * (S1 + S2);
M2 = 0.5 * (PP + S1);
M3 = 0.5 * (PP + R1);
M4 = 0.5 * (R1 + R2);
M5 = 0.5 * (R2 + R3);
return error;
}
//+------------------------------------------------------------------+
// DeleteAllObjects - This function will delete all objects from the
// chart for all history counts and future counts.
//+------------------------------------------------------------------+
void DeleteAllObjects()
{
int shift = 0;
// loop through all periods and remove objects
for (shift = 0; shift <= iCountPeriods; shift++)
{
LevelsDelete(gPeriod, shift);
}
LevelsDelete("F" + gPeriod, 0);
return;
}
//+------------------------------------------------------------------+
// LevelsDelete - This function will delete all objects that were
// created by this program.
//+------------------------------------------------------------------+
void LevelsDelete(string PeriodStr,
int Shift)
{
string uniquePrefix = UniqueID + "_"; // Create a unique prefix for object names
ObjectDelete(uniquePrefix + PeriodStr + "R3_T" + Shift);
ObjectDelete(uniquePrefix + PeriodStr + "R2_T" + Shift);
ObjectDelete(uniquePrefix + PeriodStr + "R1_T" + Shift);
ObjectDelete(uniquePrefix + PeriodStr + "PP_T" + Shift);
ObjectDelete(uniquePrefix + PeriodStr + "S1_T" + Shift);
ObjectDelete(uniquePrefix + PeriodStr + "S2_T" + Shift);
ObjectDelete(uniquePrefix + PeriodStr + "S3_T" + Shift);
ObjectDelete(uniquePrefix + PeriodStr + "R3_P" + Shift);
ObjectDelete(uniquePrefix + PeriodStr + "R2_P" + Shift);
ObjectDelete(uniquePrefix + PeriodStr + "R1_P" + Shift);
ObjectDelete(uniquePrefix + PeriodStr + "PP_P" + Shift);
ObjectDelete(uniquePrefix + PeriodStr + "S1_P" + Shift);
ObjectDelete(uniquePrefix + PeriodStr + "S2_P" + Shift);
ObjectDelete(uniquePrefix + PeriodStr + "S3_P" + Shift);
ObjectDelete(uniquePrefix + PeriodStr + "R3_L" + Shift);
ObjectDelete(uniquePrefix + PeriodStr + "R2_L" + Shift);
ObjectDelete(uniquePrefix + PeriodStr + "R1_L" + Shift);
ObjectDelete(uniquePrefix + PeriodStr + "PP_L" + Shift);
ObjectDelete(uniquePrefix + PeriodStr + "S1_L" + Shift);
ObjectDelete(uniquePrefix + PeriodStr + "S2_L" + Shift);
ObjectDelete(uniquePrefix + PeriodStr + "S3_L" + Shift);
ObjectDelete(uniquePrefix + PeriodStr + "M0_T" + Shift);
ObjectDelete(uniquePrefix + PeriodStr + "M1_T" + Shift);
ObjectDelete(uniquePrefix + PeriodStr + "M2_T" + Shift);
ObjectDelete(uniquePrefix + PeriodStr + "M3_T" + Shift);
ObjectDelete(uniquePrefix + PeriodStr + "M4_T" + Shift);
ObjectDelete(uniquePrefix + PeriodStr + "M5_T" + Shift);
ObjectDelete(uniquePrefix + PeriodStr + "M0_P" + Shift);
ObjectDelete(uniquePrefix + PeriodStr + "M1_P" + Shift);
ObjectDelete(uniquePrefix + PeriodStr + "M2_P" + Shift);
ObjectDelete(uniquePrefix + PeriodStr + "M3_P" + Shift);
ObjectDelete(uniquePrefix + PeriodStr + "M4_P" + Shift);
ObjectDelete(uniquePrefix + PeriodStr + "M5_P" + Shift);
ObjectDelete(uniquePrefix + PeriodStr + "M0_L" + Shift);
ObjectDelete(uniquePrefix + PeriodStr + "M1_L" + Shift);
ObjectDelete(uniquePrefix + PeriodStr + "M2_L" + Shift);
ObjectDelete(uniquePrefix + PeriodStr + "M3_L" + Shift);
ObjectDelete(uniquePrefix + PeriodStr + "M4_L" + Shift);
ObjectDelete(uniquePrefix + PeriodStr + "M5_L" + Shift);
ObjectDelete(uniquePrefix + PeriodStr + "BZ_" + Shift);
ObjectDelete(uniquePrefix + PeriodStr + "SZ_" + Shift);
ObjectDelete(uniquePrefix + PeriodStr + "BDL_" + Shift);
ObjectDelete(uniquePrefix + PeriodStr + "BDR_" + Shift);
}
//+------------------------------------------------------------------+
// PlotTrend - This function will plot a pivot level to the chart.
//+------------------------------------------------------------------+
bool PlotTrend(const long Chart_ID = 0,
string Name = "trendline",
const int Subwindow = 0,
datetime Time1 = 0,
double Price1 = 0,
datetime Time2 = 0,
double Price2 = 0,
const color Clr = clrBlack,
const int Style = STYLE_SOLID,
const int Width = 2,
const bool Back = true,
const bool Selection = false,
const bool Ray = false,
const bool Hidden = true)
{
ResetLastError();
if(!ObjectCreate(Chart_ID, Name, OBJ_TREND, Subwindow, Time1, Price1, Time2, Price2))
{
Print(__FUNCTION__, ": failed to create trendline = ", GetLastError());
return(false);
}
ObjectSetInteger(Chart_ID, Name, OBJPROP_COLOR, Clr);
ObjectSetInteger(Chart_ID, Name, OBJPROP_STYLE, Style);
ObjectSetInteger(Chart_ID, Name, OBJPROP_WIDTH, Width);
ObjectSetInteger(Chart_ID, Name, OBJPROP_BACK, Back);
ObjectSetInteger(Chart_ID, Name, OBJPROP_SELECTABLE, Selection);
ObjectSetInteger(Chart_ID, Name, OBJPROP_SELECTED, Selection);
ObjectSetInteger(Chart_ID, Name, OBJPROP_RAY, Ray);
ObjectSetInteger(Chart_ID, Name, OBJPROP_HIDDEN, Hidden);
return(true);
}
//+------------------------------------------------------------------+
// PlotRectangle - This function will plot a take profit zone to the chart.
//+------------------------------------------------------------------+
bool PlotRectangle( const long Chart_ID = 0,
string Name = "rectangle",
const int Subwindow = 0,
datetime Time1 = 0,
double Price1 = 1,
datetime Time2 = 0,
double Price2 = 0,
const color Clr = clrGray,
const bool Back = true,
const bool Selection = false,
const bool Hidden = true)
{
if(!ObjectCreate(Chart_ID, Name, OBJ_RECTANGLE, Subwindow, Time1, Price1, Time2, Price2))
{
Print(__FUNCTION__, ": failed to create rectangle = ", GetLastError());
return(false);
}
ObjectSetInteger(Chart_ID, Name, OBJPROP_COLOR, Clr);
ObjectSetInteger(Chart_ID, Name, OBJPROP_BACK, Back);
ObjectSetInteger(Chart_ID, Name, OBJPROP_SELECTABLE, Selection);
ObjectSetInteger(Chart_ID, Name, OBJPROP_HIDDEN, Hidden);
return(true);
}
//+------------------------------------------------------------------+
// PlotText - This function will plot a text box to the chart. Used to
// plot pivot labels and prices.
//+------------------------------------------------------------------+
bool PlotText( const long Chart_ID = 0,
string Name = "text",
const int Subwindow = 0,
datetime Time1 = 0,
double Price1 = 0,
const string Text = "text",
const string Font = "Arial",
const int Font_size = 10,
const color Clr = clrGray,
const int Anchor = ANCHOR_RIGHT_UPPER,
const bool Back = true,
const bool Selection = false,
const bool Hidden = true)
{
ResetLastError();
if(!ObjectCreate(Chart_ID, Name, OBJ_TEXT, Subwindow, Time1, Price1))
{
Print(__FUNCTION__,": failed to create text = ",GetLastError());
return(false);
}
ObjectSetString(Chart_ID, Name, OBJPROP_TEXT, Text);
ObjectSetString(Chart_ID, Name, OBJPROP_FONT, Font);
ObjectSetInteger(Chart_ID, Name, OBJPROP_FONTSIZE, Font_size);
ObjectSetInteger(Chart_ID, Name, OBJPROP_COLOR, Clr);
ObjectSetInteger(Chart_ID, Name, OBJPROP_ANCHOR, Anchor);
ObjectSetInteger(Chart_ID, Name, OBJPROP_SELECTABLE, Selection);
ObjectSetInteger(Chart_ID, Name, OBJPROP_SELECTED, Selection);
ObjectSetInteger(Chart_ID, Name, OBJPROP_HIDDEN, Hidden);
return(true);
} 
Disliked{quote} Is it not possible to code or any thing else? the .mq5 is given by you only!!Ignored
DislikedHello coders, how are you? Could you add the upper and lower level options to the inputs and color the indicator only when it is outside these levels? Thank you very much ;* {file} {image}Ignored

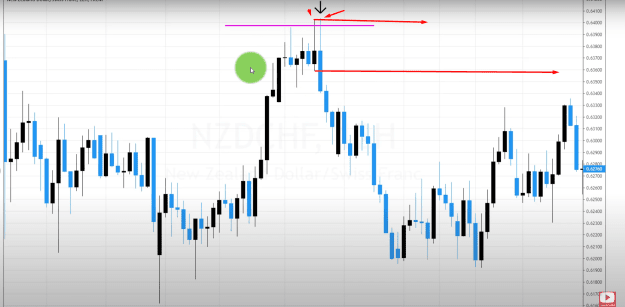
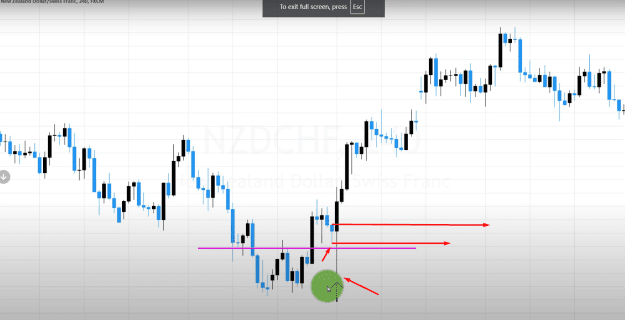
Dislikedcan anyone create this EA in mq5. in this i am using envelope indicator under rsi but the envelope is not being calculated as per the 0-100 rsi range only it is being plotted under the rsi's 0-100 range. the envelope should get calculated as per it's original calculation (Price based) inside rsi. 1). When the envelope crosses below and after then closed below rsi level 80 then it should take sell trade. 2). When the envelope crosses above and after then closed above rsi level 20 then it should take buy trade. 3). Mark level 80 as (Sell), 20 as (Buy), 90 as (Strong Sell), 10 as (Strong Buy), 91 as (Super Sell), 9 as (Super Buy). 4). Lot size should be editable from the settings. 5). Levels of the rsi should be editable from the settings. 6). Rsi and envelope lines should be editable from the settings. 7). Trailing stoploss feature should be there so that if user wants to use it then they can or else they can set to false. in trailing stoploss function the user should get 2 inputs like how much TSL shift in how much movement (10 pips shift on every 30 pips movement). so 10 and 30 is user defined. 8). Take profit feature should be there, it's up to user to use it or not. (True or False). 9). If possible then Plot a Dashboard on the chart, showing the successful trades in numbers, Losing trades in numbers, total pips captured in profits, total pips captured in loss. (If you want to see exactly what i am talking about then setup the indicator in your desktop or cell phone as per the settings of the indicator i have shared images of, you will get the idea). i have tried to code this and in my code the envelope is started being calculated as per the 0-100 range of rsi instead of preice based. Thank you in Advance dear Coder + Trader. {image} {image} {image} {image} {image}Ignored


Disliked{quote} О, я понимаю, что ты пытаешься сказать, мы не можем использовать статический (в диапазоне) индикатор...Ignored
Dislikedpls helpme combine the two indicator into one and fix this indicator sothat i donsnt repaint and that the arrows for intraday-swing3 should appear on triger candle {file} {file}Ignored