Good question Brok, I always try to catch a trend from the top or bottom. I confirm the short to medium term trend from the 4Hr charts and enter on 1Hr charts. When I follow that method there are guranteed 200 pips on the table. After doing it for so long , I'm so condifent about my target expectency, I could even turn the computer off and go play with my kids.
If the price retrace back to 5 sma(true price) that the best point to enter the market. But say, as an example on a trend change scenario from bear to bull first 1hr MACD will cross over to bullish side(Zero Line).Then few hours later 4 hours MACD is still below Zero but bullish inducator line(usually the blue line) has crossed the bearish line(the red line) upwards. This is a great indication of change in the medium -short trend from bear to bull. Then you eneter the market as closer to the 5 SMA. Entering @ 5 SMA is ideal but some time if the trend is very strong with a good momentum the price may not retrace to 5 sma... so I try to enter as closeer to the 5 SMA since I may miss the entry point if I wait for the price to retrace to 5 SMA.
You will learn more about this in the near future as I will update evry step on the trend development scenarios on this thread with graphical images of my charts
I think one has to be careful to watch those cycles and see if one of them breaks the H4 cycle... or is the H4 cycle always going to win to the lower timeframes cycles?
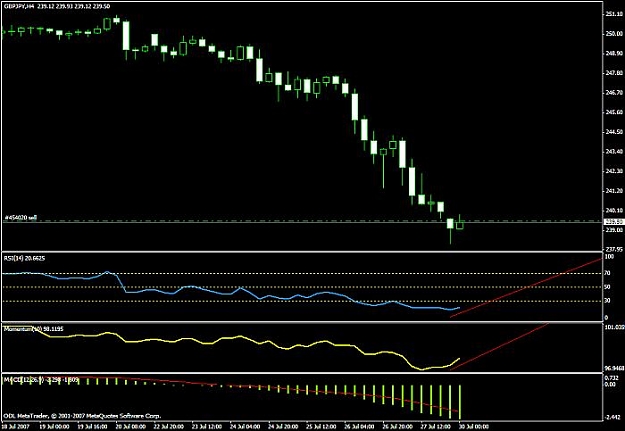
You said that the 4 hour is still bearish. Could you elaborate? It seems that the Momentum has turned up and the RSI is nudging that way. MACD, however, is still very bearish. Just trying to clarify how you view the Momentum indicator in this situation. Thanks.
If we have already seen 240, that means the gap is filled.
Ignored
I use the FXCM trading platform and 240.00 has been the high so far - it touched momentarily and then went back down. So I guess yep, I agree, the gap was filled. Unless someone see's it differently on their platform?
I use the FXCM trading platform and 240.00 has been the high so far - it touched momentarily and then went back down. So I guess yep, I agree, the gap was filled. Unless someone see's it differently on their platform?
I use the FXCM trading platform and 240.00 has been the high so far - it touched momentarily and then went back down. So I guess yep, I agree, the gap was filled. Unless someone see's it differently on their platform?
kokanee
Ignored
not on my platform - havent seen it fill yet
how bout u guys
Not a signal yet - but auslanco did say the re-tracement should be up to the ~240ish level (I think he even said 240.15 or so). He did say that 240.05-10 would be a good area to think of shorting - and put a SL at 240.80. BUT, that was earlier today - his ideas/charts could be saying something different now.
I use the FXCM trading platform and 240.00 has been the high so far - it touched momentarily and then went back down. So I guess yep, I agree, the gap was filled. Unless someone see's it differently on their platform?
kokanee
Ignored
Really? Dont say! I also use FXCM and the highest high of today has been 239.91 . In the afternoon I noticed also some diferences with my charts and the ones of Oanda...
Ado
Whether you believe you can do a thing or not, you are right.
Hi rumbey, Welcome to the threadAs you may have already figured out I dont look at this pair in the prospective of a carry trade. I treat it like just another pair with high volatality. I only act according to my indicators., but not for anythng esle.
That will always keep me away from bad trades. If my indicators shows me tommorrow that it's going up then I go up.
I have attached a latest Daily charts. I cant figure out on what basis you are telling me that the daily charts are still bullish.
Ignored
what are those arrows at the bottom? is that a custom indicator? right where it says the date.