Thanks srt but I was looking for the original indy in this thread that will show multiple pairs at one time. Original indy wont complie with new MT4 build. For me anyway
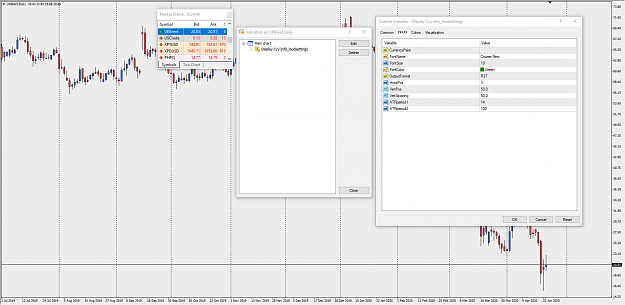
Cool..infact that was was i was about to ask abt that "output format" feature. Thanks again EDIT : Just tried it ! The following are the details and settings i have set in by editing the indicator (attached) by hanover. (& are Default) - Concise (less workspace) , Less Clutter - No decimals - 4 majors - Positioning Top left ScreenShot {image} Hope that helps anyone else. Regards {file}
Try the attached. The 3 values output, in order, are: ATR(D1,14) ATR(D1,100) Current day's H-L (thus far) You can use shorthand to enter the pairs: e.g. GU or gu for GBPUSD Valid abbreviations are: A = AUD C = CAD E = EUR F = CHF G = GBP J = JPY N = NZD U = USD Pairs must be separated by commas, e.g. GU,EU,UF,UJ {file}
Ignored
Hi hanover ,
thanks for sharing this indicator . but I'm not able to compile it with latest Mt4 build version . is it possible for you to provide us the latest "Display Ccy Info.mq4 "?
Try the attached. The 3 values output, in order, are: ATR(D1,14) ATR(D1,100) Current day's H-L (thus far) You can use shorthand to enter the pairs: e.g. GU or gu for GBPUSD Valid abbreviations are: A = AUD C = CAD E = EUR F = CHF G = GBP J = JPY N = NZD U = USD Pairs must be separated by commas, e.g. GU,EU,UF,UJ {file}
Ignored
hello....Respected Hanover Sir,
I have your indicator Display Ccy info..my mt4 is build 1090,
indicators not working on it , could you please help me on this ..
Indicator is old and needs MetaEditor/compiler build 509 to compile correctly. Delete the MQ4 files and try the attached:{file}{file} Or alternatively, if you want to keep the MQ4 files, do this.
Ignored
Respected Hanover Sir,
I have many other indi. which are facing some compiler issues,but you made it easy for me through your reply with other link provided.
Great Detailed Explanation which really help newbies.
I have no words to praise you....you are one of the greatest human being, you are like an ANGEL . Sir....Hats off to you
I have many other indi. which are facing some compiler issues,but you made it easy for me through your reply with other link provided.
Ignored
Glad to hear that you got it to work.
I wasn't sure whether simply unzipping the file would load all of the required files into the correct (sub)folders. I expect that it depends on which unzip program you use, and how it operates.
Indicator is old and needs MetaEditor/compiler build 509 to compile correctly. Delete the MQ4 files and try the attached:{file}{file} Or alternatively, if you want to keep the MQ4 files, do this.
Indicator is designed to work only on major currencies, as tickvalue for exotics, metals, etc can differ from broker to broker. There are lots of other indicators that display ADR (easily found using Google).
{quote}Indicator is designed to work only on major currencies, as tickvalue for exotics, metals, etc can differ from broker to broker. There are lots of other indicators that display ADR (easily found using Google).
Ignored
Think you could look at a code for me? I am just trying to add a modification of an alert when an arrow comes out but i dont understand the code. Thank You, sorry I could not PM as I am still new member.
Joined Feb 2009
|
Status: Down to Earth!
|2,358 Posts
Can someone create an ATR Dashboard indicator based on the range formula day=11, week=17, but sorted from largest to smallest, like this free indicator from Netsrac? Source: https://www.mql5.com/en/market/produ...in#description . This indicator is too complicated and complex.
Can someone create an ATR Dashboard indicator based on the range formula day=11, week=17, but sorted from largest to smallest, like this free indicator from Netsrac? Source: https://www.mql5.com/en/market/produ...in#description . This indicator is too complicated and complex. {image}
Ignored
I love my dashboard, set it, and forget it, but yes, a sorting function would be nice, all I can think of is to use Excel.
Attached Image (click to enlarge)
Here is an example to motivate you; a benefit of Excel, you can add columns each week and monitor the changes.
Attached Image (click to enlarge)
Or maybe that is complicated and complex also, good luck.
PS: can you share the basis of ADR 11 and AWR 17? Something special you noticed? 17 x 3 is 51 weeks, take 1 week off?
It takes a lot for me to IGNORE you, but you can try.
{quote} I love my dashboard, set it, and forget it, but yes, a sorting function would be nice, all I can think of is to use Excel. {image} Here is an example to motivate you; a benefit of Excel, you can add columns each week and monitor the changes. {image} Or maybe that is complicated and complex also, good luck. PS: can you share the basis of ADR 11 and AWR 17? Something special you noticed? 17 x 3 is 51 weeks, take 1 week off?
Ignored
Well, actually in the PVSRA system, https://www.forexfactory.com/thread/...me-sr-analysis each chart already has its range, and it can be set properly. I monitor and arrange it every morning, then trade in the afternoon. However, if there’s a small automatic indicator that organizes it, it might be better than having to sort it manually in Excel.
Regarding ADR 11 or AWR 17, these are just estimates. From my years of observing the 28 pairs with that ATR formula, using 1/3 or 2/3 of the range as a target tends to be hit more often than the default value. Occasionally, the range extends or contracts over the years, as it goes through certain periods. In the past, it seems the range was longer. As for the 3/3 target, it’s quite difficult to achieve, although sometimes with specific news events, the price can move far beyond its daily range.
On the GBPJPY chart, for example, marked with a gold circle, the ATR (in pips) was 184 pips (on that day). However, due to the red news, it moved up to 234 pips. If our directional guess is correct on that day, then 1/3 or 2/3 of the TP from 184 pips will be reached (meaning). Around 61 pips for 1/3 and 122 pips for 2/3. The stop loss remains one unit risk (say 0.71%), which is 61 pips, and unfortunately, my SL was hit yesterday because my directional guess was wrong. Without an SL, it would have been a "so long" situation. One red candle 60 -70 pips that day before red news to nuke them all (stop loss hunting). After red news, reverse polarity.
Quote
Disliked
5. Range High/Low Lines for the Day and Week -
You can display two horizontal lines, one for the computed range high target, and one for the computed range low target. The range is based on the averaging period you select (defaults: day=15, week=13). The special range averaging process for the Day range lines skips any brief Sunday sessions of some brokers, which would drag the average down. The Week range lines use the standard ATR formula since brief Sunday sessions do not much affect the results. Range lines can be static (positioned at the ATR distance from the Day or Week Open price) or floating (~), described below:
Quote
Disliked
A. Two conditions determine where floating (~) range lines appear....
1. Condition #1 - the Day/Week range has not exceeded the computed average range.
* The RDH/RWH line is the computed average range distance above the session Low.
* The RDL/RWL line is the computed average range distance below the session high.
* The lines will move as new highs/lows are achieved during the session.
* This display shows how far price can move in either direction before exceeding the computed average range.
2. Condition #2 - the Day/Week range has exceeded the computed average range.
* If price swings during the day/week TF cause the difference between the high and the low to equal the computed range, the range lines lock into place.
* This display will clearly show any subsequent breakout of the range.
B. The purpose of the range lines is to provide a perspective on how far PA might move during the trading day or week. This can be of some guidance in selecting where to exit a trade. A swing trader might pay more attention to the RWH/RWL lines, and hold a trade into oncoming days. However, a day trader looking for quick profits and limited exposure to market price swings might pay more attention to the RDH/RDL lines.
{quote} Well, actually in the PVSRA system, https://www.forexfactory.com/thread/...me-sr-analysis each chart already has its range, and it can be set properly. I monitor and arrange it every morning, then trade in the afternoon. However, if there’s a small automatic indicator that organizes it, it might be better than having to sort it manually in Excel. Regarding ADR 11 or AWR 17, these are just estimates. From my years of observing the 28 pairs with that ATR formula, using 1/3 or 2/3 of the range as a target tends...
Ignored
Yes, that is an excellent indicator and free too; it's not for beginners, as it is quite complex, so congratulations to you sir!
Another thing about the previously mentioned Dashboard, it can also serve as a Single indicator on each pair.
This is how I set it up, and the information I'm observing:
1. ADR at 60 - this is approximately last 3 months trading of the daily price moves.
2. ADR at 10 - compare this with 60 to check the recent volatility, is the range larger or smaller.
3. Previous day range, always interesting after very small or very large days.
4. Daily range - can give great targets for profit taking, combined with session times, or end of day, of course.
These are more important to me, on a pair-by-pair basis, than having the list sorted.
I see you have a solution, so good luck
Attached Image (click to enlarge)
It takes a lot for me to IGNORE you, but you can try.
{quote} Yes, that is an excellent indicator and free too; it's not for beginners, as it is quite complex, so congratulations to you sir! Another thing about the previously mentioned Dashboard, it can also serve as a Single indicator on each pair. This is how I set it up, and the information I'm observing: 1. ADR at 60 - this is approximately last 3 months trading of the daily price moves. 2. ADR at 10 - compare this with 60 to check the recent volatility, is the range larger or smaller. 3. Previous day range, always interesting after very small...
Ignored
Actually, what I mainly need is just the ATR derived from the ADR (in pips) with a specific period. For example, today before the London session, I monitored 8 pairs that have a range above 99 pips (because my method requires a minimum Stop Loss of 33 pips). Additionally, there is 1 exceptional pair, EURNZD, with a range of about 97 pips. So, I will likely only trade those pairs from the 28 available pairs. It’s very useful as a filtering tool.
From that, I can calculate the risk for 1 unit. For example, on GBPJPY today, 1/3 of the range is 69 pips. So, a 1:1 RR unit with a 0.71% daily risk equals 0.41 lots (since the current pip value is $6.34, which is dynamic and changes constantly). The target might change to a 1:2 or 1:3 RR depending on the situation, but ideally, I only aim for 1/3 of the 7-day ATR (or other ATR), which is 69 pips.
A GBPJPY chart for today with potential RDH (Range Day High) and RDL (Range Day Low) set as static (or can also be dynamic, meaning adjustable). Next, simply determine the direction.