The Money Line - A new way to see divergence
The Money Line is an indicator I have created to use specifically on the 1 minute chart to see divergence in volatility vs price. It clearly shows the weakness in moves aimed at sweeping highs and lows.
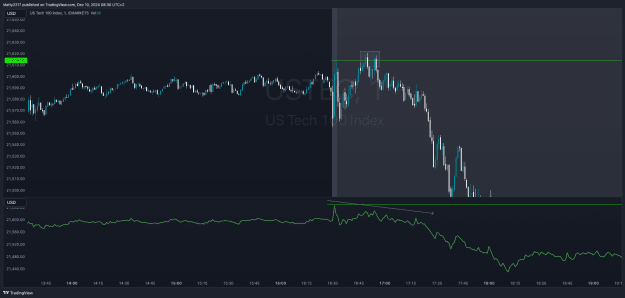
Here are some recent examples:

You can see price made a high on the equities open, it then sweeped the high but the money line clearly shows weakness in the actual move.


Rules:
Timeframe = 1 minute
Best during high volume times of day. I use specifically from the equities open.
Price MUST sweep high or low
I like to enter on an engulf
Stop and TP are up to you, but the stops can be quite tight from my back testing.
I will publish the link to the indicator (TradingView) on here, but I believe it can be coded for mt4 as well.
The Money Line is an indicator I have created to use specifically on the 1 minute chart to see divergence in volatility vs price. It clearly shows the weakness in moves aimed at sweeping highs and lows.
Here are some recent examples:
Attached Image (click to enlarge)
You can see price made a high on the equities open, it then sweeped the high but the money line clearly shows weakness in the actual move.
Attached Image (click to enlarge)
Attached Image (click to enlarge)
Rules:
Timeframe = 1 minute
Best during high volume times of day. I use specifically from the equities open.
Price MUST sweep high or low
I like to enter on an engulf
Stop and TP are up to you, but the stops can be quite tight from my back testing.
I will publish the link to the indicator (TradingView) on here, but I believe it can be coded for mt4 as well.