Monthly/Weekly/Daily Analysis!
TA-Monthly:

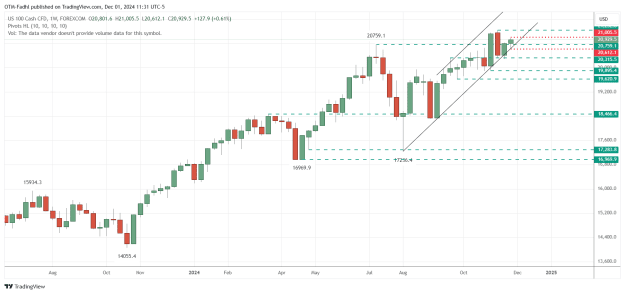
NQ monthly candle closed bullish. A continuation up should be expected.
1- 20649-20759 are an aggressive value areas to jump in and go long.
2- 20404-20650 (61.8-50 fib) are a great value areas to go long
TA-Weekly:
NQ Weekly candle is an inside bar, inside the Red candle which is also inside the previous green candle. So uncertainty and noise have characterized the price behavior for the last three weeks.
We need a breakout to have a clear decision. Hence there is no opportunity from weekly TF to jump in until price brakes and close either above 21233 or below 20312 (and even below 19895).
TA-Daily:

Same as weekly, price is inside red daily bar. Uncertainty and noise until the breakout.
Price made a retrace to +61.6 Fib and resumed up. We should expect a continuation to make a new HH and brake the high of the red candle and better a close above 21005.
A buy stop or watching lower TF closing above this level 21005 is an indication for an aggressive jump in.
FA Analysis:
1- During last month, the US Elections provided a clear outcome that was translated in a bullish behavior from US equities. Market will pay attention to Trump from January with tariffs...
2- Risk of wars (M.E. & R-U) has been fading out with few hiccups got knee-jerk market attention and quickly dismissed from the picture.
3- US Economy is strong supported with strong data. This is good for equities.
For ST perspective, we have the results of Black Friday and Cyber Monday that will provide the ebbs and flows for a clear direction: up (most likely) or down.
Also we have major US data this week with NFP.
GL Everyone!
TA-Monthly:
Attached Image (click to enlarge)
NQ monthly candle closed bullish. A continuation up should be expected.
1- 20649-20759 are an aggressive value areas to jump in and go long.
2- 20404-20650 (61.8-50 fib) are a great value areas to go long
TA-Weekly:
Attached Image (click to enlarge)
NQ Weekly candle is an inside bar, inside the Red candle which is also inside the previous green candle. So uncertainty and noise have characterized the price behavior for the last three weeks.
We need a breakout to have a clear decision. Hence there is no opportunity from weekly TF to jump in until price brakes and close either above 21233 or below 20312 (and even below 19895).
TA-Daily:
Attached Image (click to enlarge)
Same as weekly, price is inside red daily bar. Uncertainty and noise until the breakout.
Price made a retrace to +61.6 Fib and resumed up. We should expect a continuation to make a new HH and brake the high of the red candle and better a close above 21005.
A buy stop or watching lower TF closing above this level 21005 is an indication for an aggressive jump in.
FA Analysis:
1- During last month, the US Elections provided a clear outcome that was translated in a bullish behavior from US equities. Market will pay attention to Trump from January with tariffs...
2- Risk of wars (M.E. & R-U) has been fading out with few hiccups got knee-jerk market attention and quickly dismissed from the picture.
3- US Economy is strong supported with strong data. This is good for equities.
For ST perspective, we have the results of Black Friday and Cyber Monday that will provide the ebbs and flows for a clear direction: up (most likely) or down.
Also we have major US data this week with NFP.
GL Everyone!
3


