MODIFIED VALUE CHART PROBABILITY
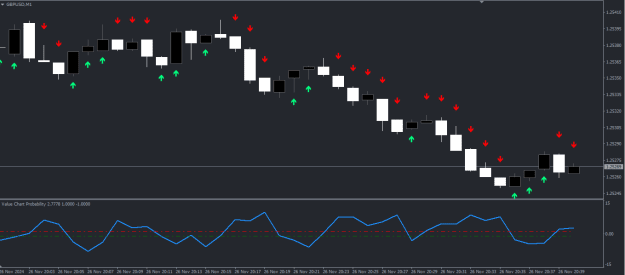
The VALUE CHART PROBABILITY indicator is a reimagined version of the original, featuring several modifications to alter its mathematical calculation. Additionally, a function has been added to detect the size of the current range and divide it by the indicator's momentum flow, thereby assessing the probability of the current candle continuing in a specific direction.
This indicator aims to track in real-time where the current candle is likely to move, achieving a positive accuracy rate of over 80%.
To test the indicator, visit the link below:
https://www.mql5.com/pt/market/product/127344
The indicator can be used with any asset and on any timeframe, as its primary goal is always to determine the likely direction of the current candle based on its updated calculation for each timeframe.
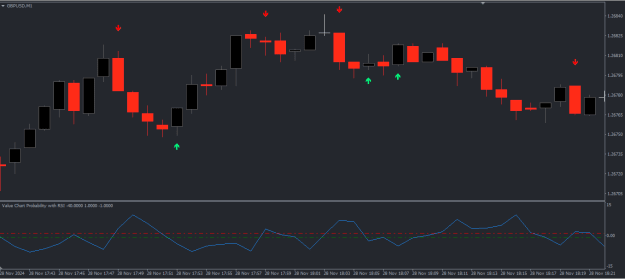
Attached Image(s) (click to enlarge)