Hell of a week with ranging all over the place. Recovered my first 2 days losses and ended up with nearly 2% for the week. Any weekly profit is better than a loss
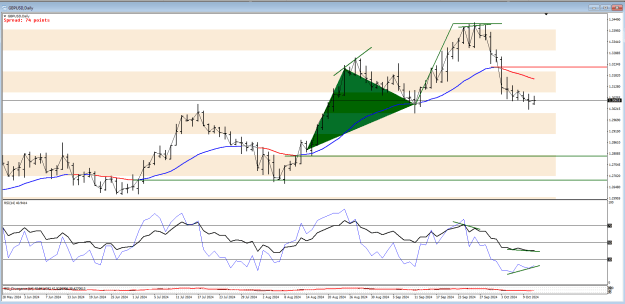
{quote} G'day mate. You have the charts ABCD a tad wrong. You have A at the divergence pivot, it should be the one before. It has hit the D target in divergence to send it short again from the D ZOO point. Should look like this... {image}
Ignored
Cheers boss,
I don't really use the ABCD as I cant tell which direction it will go and even a confirming support candle can turn against me. I look for the divergence at the extremes and try to head back to the EMA again. Interesting what you say about the wrong A point (looks like B to me) made by the indi and i should have picked the one before. I always thought it was the highest/lowest close to make the ABCD triangle and now I am confused. Correct me if i am wrong but we don't include the divergence pivot that crosses the EMA in the ABCD triangle drawing?
Looking back at previous post 1604 we have:-
Lets consider AC first... This is a line drawn from the attacking pivot to the pivot being attacked on the price chart. If the right side C is lower than A we then check the corresponding pivots on the slow RSI. If the right side is higher than the left then we have the divergence.
Now we look for the B point and this is always the lowest low (or highest high) between the two conflicting pivots. We are only looking at the closes.
We can now connect the points to form the ABC triangle and the target is the distance AB from C. = D
{quote} Cheers boss, I don't really use the ABCD as I cant tell which direction it will go and even a confirming support candle can turn against me. I look for the divergence at the extremes and try to head back to the EMA again. Interesting what you say about the wrong A point (looks like B to me) made by the indi and i should have picked the one before. I always thought it was the highest/lowest close to make the ABCD triangle and now I am confused. Correct me if i am wrong but we don't include the divergence pivot that crosses the EMA in the...
Ignored
Well, this is interesting because I always used the div pivot but amended this to be the pivot price was in div with. The reasoning behind this is that it presents a shorter distance target so even if it runs on to the div pivot target we still win.
Once it does hit the target it is most often the case it does so in div, so this presents us with a ZOO point to trade in the opposite direction.
It's all about finding these ZOO points to take advantage of.
Hey Alan,
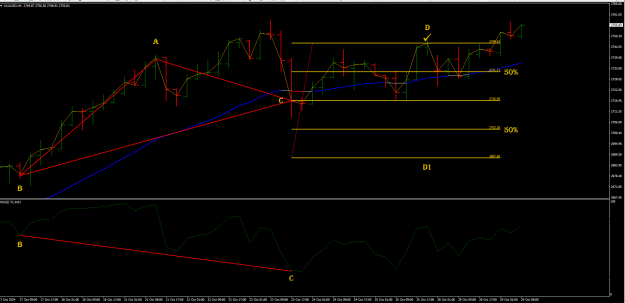
Hey Alan, I hope you’re doing well. I've been using your trading method for a while, but recently I encountered something unexpected. In the 4H chart in the image below, the price clearly failed at the 50% level, but instead of forming an ABCD pattern as expected (yellow line), but then it reversed upwards. Why did this happen?
Sorry for the tiny marked up, I failed to make it bigger
Hey Alan, Hey Alan, I hope you’re doing well. I've been using your trading method for a while, but recently I encountered something unexpected. In the 4H chart in the image below, the price clearly failed at the 50% level, but instead of forming an ABCD pattern as expected (yellow line), but then it reversed upwards. Why did this happen? Sorry for the tiny marked up, I failed to make it bigger {image}
Ignored
I must be getting old because it took me a while to work out what was wrong here. The chart appeared to be the complete opposite of my 4-hour chart. Then it dawned on me like a bolt from the blue. Yours is not the GBP/USD so I cannot comment. I only trade the one pair which is plenty enough work to do.
Using your chart it all looks good to me heading for the D target not the D1
{quote} I must be getting old because it took me a while to work out what was wrong here. The chart appeared to be the complete opposite of my 4-hour chart. Then it dawned on me like a bolt from the blue. Yours is not the GBP/USD so I cannot comment. I only trade the one pair which is plenty enough work to do. Using your chart it all looks good to me heading for the D target not the D1 {image}
Ignored
Yes I do believe it would heading D not D1, but what I wanna ask is that if the 50% failed, then it can still hit D not D1? Because previously, I thought if 50% level is failed then it would definitely hit D1 with no doubt.
{quote} Yes I do believe it would heading D not D1, but what I wanna ask is that if the 50% failed, then it can still hit D not D1? Because previously, I thought if 50% level is failed then it would definitely hit D1 with no doubt.
Ignored
Well, the 50% levels on both sides are critical because if price stays between these two levels it is ranging, we then need to see a breakout of these 50% levels.
Often the best trades are when price has actually hit the D1 or D targets and if in divergence a counter trade is on the cards, this can often run from one side completely to the opposite side.
I watch for the 50% failures but that doesn't mean it will always make the opposite side, as I said it could simply be ranging.
{quote} Well, the 50% levels on both sides are critical because if price stays between these two levels it is ranging, we then need to see a breakout of these 50% levels. Often the best trades are when price has actually hit the D1 or D targets and if in divergence a counter trade is on the cards, this can often run from one side completely to the opposite side. I watch for the 50% failures but that doesn't mean it will always make the opposite side, as I said it could simply be ranging.