Start taking chart from 13 ) London SUMMER time,
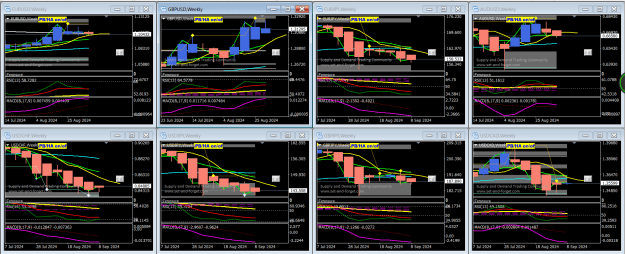
what s there to see in the weekly TMS... where is price coming from
what s there to see in the daily TMS...
what s there to see in the H4 TMS...
what s there to see in the H1 TMS...
what s there to see in the M15 TMS...
what s there to see in the M5 TMS...
Now compare to the H1, M15, M5 in standard candlestick chart
then show the H1 in standard candlestick chart
then show the M15 in standard candlestick chart
then show the M5 in standard candlestick chart
Then today's news
then M5 at 13:35, London, GMT+1
then M5 at 13:40, London, GMT+1
then M5 at 13:45, London, GMT+1
then M5 at 13:50, London, GMT+1
then M5 at 13:55, London, GMT+1
then M5 at 14:00, London, GMT+1
then M5 at 14:15, London, GMT+1
then M5 at 14:30, London, GMT+1
then M5 at 14:35, London, GMT+1
PS update: remove all attached pics, (except 1 to show the TMS is what I am studying is trading that simple.) to make thread less heavy. Found all those pics say nothing close to what really happened
Attached Image (click to enlarge)