Daily chart shows Weds resistance level held on Thurs so Fri last trading day of the month looks a little bearish at the moment. {image}
Ignored
Let me tip you for a moment. Try this, change the colors of ur candles only for bar up and bar down. Put the colors to None. Then see the closure of daily again. You will see something
{quote} You can delete it already. Since 2524 has been tested, if tested again it wont tap 2526. It will break ath. You can just watch, or see if price rejects at 2518. There u can sell with breaks at 2524.
{quote} Let me tip you for a moment. Try this, change the colors of ur candles only for bar up and bar down. Put the colors to None. Then see the closure of daily again. You will see something
Ignored
Saw same as what I previously posted. As well this morning (my NYTime).
{quote} Saw same as what I previously posted. As well this morning (my NYTime). What do you see?
Ignored
I saw potential Ath again. Because there is no confirmation bearish candle on weekly and monthly.
It might also be just a fake pump and dump, nobody knows
But if you look at H4 liquidity wicks. Tested levels 2526-2524 many times. It can also be considered a strong bearish levels only in h4 chart but not daily
Joined Mar 2006
|
Status: Trade the reaction not the news!
|10,359 Posts
Tomorrow (Monday) is a holiday here in the US, Labor Day, so suppose Gold might be quiet? Once normal full trading resumes Tuesday I'm thinking uptrend ought to resume. Though need to see more intraday bars to have a firm opinion either way.
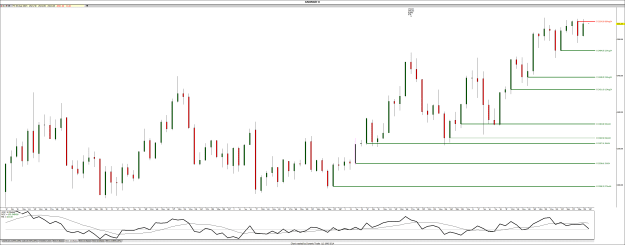
Here is my current analysis, Based on H4, We can go up to 2,548, & We will find trendline resistance there! {image} Come on guys, Push/break the subscribe botton!
Gold has provided a Monthly bullish close. So we should expect a continuation up from Monthly perspective. {image} From Weekly perspective, Gold close is irrelevant; it's an inside bar. Price needs to break either way for clear direction. {image}From daily one, it's similar to weekly; we've an inside bar; uncertainty and noise until the break of the master candle. {image}
Ignored
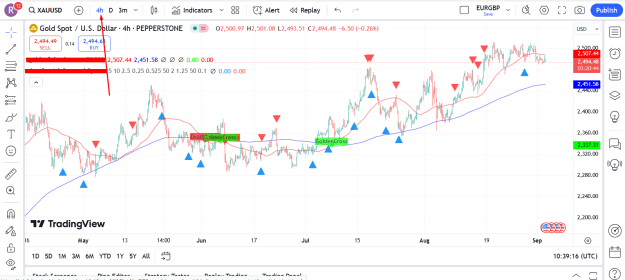
Gold has tested Wednesday Candle and closed below it at H1 TF. I think, price now may go to test the Weekly LL Candle 2470, then we go up to be inline with the Monthly bullish candle. My chart shows two scenarios, but my bias is with the sell side.
{quote} Gold has tested Wednesday Candle and closed below it at H1 TF. I think, price now may go to test the Weekly LL Candle 2470, then we go up to be inline with the Monthly bullish candle. My chart shows two scenarios, but my bias is with the sell side. {image}
Ignored
Scenario 2 got the upper hand!
I put a Buy LMT at 2470; STP 2460; TP 2530