Understanding Point & Figure (P&F) Charts
Point & Figure (P&F) charts are a unique form of technical analysis that focuses purely on price movements, ignoring time and minor fluctuations. They are particularly useful for identifying trends, support/resistance levels, and potential breakouts. Key Components of P&F Charts
X's and O's
X's = Rising prices (uptrend)
O's = Falling prices (downtrend)
Each column consists of only one symbol (either X or O).
Box Size
The minimum price increment required to add another X or O.
Example: If the box size is $1, then a $1 rise adds an X, and a $1 decline adds an O.
Reversal Amount
The number of boxes needed to switch from X's to O's (or vice versa).
Common reversals: 1-box, 3-box, or 5-box (e.g., a 3-box reversal means the price must reverse by 3x the box size to change columns).
Trend Identification
Uptrend: A series of higher X columns.
Downtrend: A series of lower O columns.
P&F charts filter out "noise," making trends clearer.
Support & Resistance
Horizontal levels where price reversals frequently occur.
Breakouts above resistance or below support signal potential trend continuations.
How to Read P&F Charts 1. Columns & Trends
X Column = Buyers are in control.
O Column = Sellers are in control.
A reversal occurs when price moves against the trend by the reversal amount.
2. Common Patterns
Double Top/Bottom:
Double Top Breakout (X's surpass previous high) = Bullish signal.
Triangles (Congestion Zones): Indicate consolidation before a breakout.
Bullish/Bearish Catapult: A breakout after a pullback, signaling strong momentum.
3. Breakouts
A new column of X's breaking above resistance = Buy signal.
A new column of O's breaking below support = Sell signal.
4. Trend Lines
Bullish Support Line: Upward-sloping line connecting O-column lows.
Bearish Resistance Line: Downward-sloping line connecting X-column highs.
5. Volume-by-Price (Optional)
Some P&F charts include volume to confirm breakouts.
Advantages of P&F Charts Noise Reduction – Filters out small price movements. Clear Trends – Easy to spot uptrends/downtrends. Objective Signals – Strict rules for entries/exits. Works for All Timeframes – Useful for both swing trading and long-term investing.
Point and Figure (P&F) Patterns Overview
Point and Figure (P&F) charting is a unique technical analysis method that focuses solely on price movements, ignoring time and volume. It uses X's (rising prices) and O's (falling prices) plotted in columns to identify trends, support/resistance levels, and key breakout patterns. Key Characteristics of P&F Charting
Price-Based, Not Time-Based
Only price movements matter; time is irrelevant.
A new column is formed only when price reverses by a predefined amount (box size).
Uses X’s (Upside Moves) and O’s (Downside Moves)
X = Price rising by the box size.
O = Price falling by the box size.
A reversal (new column) occurs when price moves against the trend by the reversal amount (e.g., 3-box reversal).
Significance of the Number "3"
Many P&F signals rely on a 3-box reversal (a move in the opposite direction by 3 boxes).
The third hit on support/resistance is often a critical breakout signal.
Categories of P&F Patterns
P&F patterns can be classified into four main categories: 1. Bullish Patterns (Signaling Upside Breakouts)
Double Top Breakout (Buy Signal)
Price breaks above a previous high (two X's in a column).
Triple Top Breakout (Stronger Buy Signal)
Price breaks above three prior highs.
Bullish Catapult
A small consolidation followed by a breakout.
Bullish Signal Reversal
A column of O's reverses into a new column of X's, breaking above resistance.
Price breaks below a previous low (two O's in a column).
Triple Bottom Breakdown (Stronger Sell Signal)
Price breaks below three prior lows.
Bearish Catapult
A small rally followed by a breakdown.
Bearish Signal Reversal
A column of X's reverses into a new column of O's, breaking below support.
3. Reversal Patterns (Trend Change Signals)
Bullish Reversal (O's to X's)
After a downtrend, a new column of X's breaks above resistance.
Bearish Reversal (X's to O's)
After an uptrend, a new column of O's breaks below support.
4. Wait-and-See (Continuation Patterns)
Bullish Continuation (High Pole)
A tall column of X's followed by a small pullback (O's), then resumption of uptrend.
Bearish Continuation (Low Pole)
A tall column of O's followed by a small bounce (X's), then continuation of downtrend.
Symmetrical Triangle (Consolidation Before Breakout)
Alternating X's and O's forming a triangle, leading to a breakout in either direction.
Bullish Point and Figure Patterns Triple Top
The pattern is formed by three rallies (1,2,3), on the third rally it pushes past the resistance line formed by the first two.
The third column will rise past the resistance line an equal distance to that of the bottoms.
Attached Image (click to enlarge)
Breakout of a Spread Triple Top
This pattern is a variation to the triple top except that on the third rally it fails to reach the resistance line. On the fourth move it breaks past the resistance line and should rise an equal amount to that of it's bottoms.
Attached Image (click to enlarge)
Ascending Triple Top
Another variation of the triple top except in this case each consecutive top is higher than the last. However this pattern does not give a price objective like the triple top. The signal in this variation is to buy on the breakout.
Attached Image (click to enlarge)
Upward Breakout of a Bullish Resistance Line.
A variation of the ascending triple top except in this case there is a fourth consecutive top is higher than the last. The signal in this variation is to buy on the breakout.
Attached Image (click to enlarge)
Upward Breakout of a Bearish Resistance Line.
This pattern consists of a consecutive series of lower highs. When the price breaks through the resistance line a buy signal is given.
Bullish Trend Reversal Patterns
Attached Image (click to enlarge)
Bullish Trend Reversal Patterns
Inverted Head and Shoulders Pattern
The inverted head and shoulders pattern is found in candlestick, point and figure, and chart patterns and is considered one of the most reliable reversal patterns.
The price forms a low on column one, followed by a period of consolidation. A second low is created followed by another period of consolidation, the right shoulder is then formed followed by a buy signal as it crosses the neckline.
Parralel support and resistance lines can be drawn as well as a visible neckline.
The height of the lowest low should give a projection of the strength of the upward move.
Attached Image (click to enlarge)
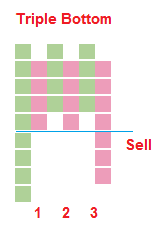
Triple Bottom
The triple bottom is a variation of the inverted head and shoulders pattern. This pattern consists of three lows of similar height. After the third low is formed and the price movement breaks the neckline, a bullish signal is given. The expected rise should be of similar height as from the neckline to the low.
Attached Image (click to enlarge)
Double Bottom
The double bottom is a variation of the triple bottom pattern. This pattern consists of two lows of similar height. After the second low is formed and the price movement breaks the neckline, a bullish signal is given. The expected rise should be of similar height as from the neckline to the tops. It is important to note that before the breakout, the trend line is broken.
Attached Image (click to enlarge)
Bullish Rectangle Reversal
The downtrend forms a clear period of consolidation, the resistance line is then broken on a heavy volume day, it is at this point where the bullish signal occurs.
The pattern is formed by three downs (1,2,3), on the third drop it pushes past the support line formed by the first two.
The third column will drop past the support line an equal distance to that of the tops.
Attached Image (click to enlarge)
Breakout of a Spread Triple Bottom
This pattern is a variation to the triple bottom except that on the third rally it fails to breach the support line. On the fourth move it breaks past the support line and should drop an equal amount to that of it's tops.
Attached Image (click to enlarge)
Descending Triple Bottom
Another variation of the triple bottom except in this case each consecutive low is lower than the last. When the price drops below the support line this generates a clear selling signal.
Attached Image (click to enlarge)
Downward Breakout of a Bearish Support Line.
A variation of the descending triple bottom except in this case there is an upward bias. The signal is to sell on the support line breakout.
Attached Image (click to enlarge)
Downward Breakout of a Bullish Support Line.
This pattern consists of a consecutive series of higher lows. When the price breaks through the support line a sell signal is given.
Bearish Trend Reversals
Attached Image (click to enlarge)
Head and Shoulders
The head and shoulders pattern is found in candlestick, point and figure, and chart patterns and is considered one of the most reliable reversal patterns.
The price forms a high on column one, followed by a period of consolidation. A second high is created followed by another period of consolidation, the right shoulder is then formed followed by a sell off. High volume should be seen on the last downward move.
Parralel support and resistance lines can be drawn as well as a visible neckline.
The height of the highest high should give a projection of the drop of the final downward move.
Attached Image (click to enlarge)
Triple Top
The triple top is a variation of the head and shoulders pattern. This pattern consists of three peaks of similar height. After the third peak is formed and the price movement breaks the neckline, a bearish signal is given. The expected drop should be of similar height as from the neckline to the tops.
Attached Image (click to enlarge)
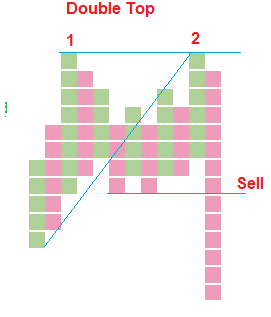
Double Top
The double top is a variation of the triple top pattern. This pattern consists of two peaks of similar height. After the second peak is formed and the price movement breaks the neckline, a bearish signal is given. The expected drop should be of similar height as from the neckline to the tops. It is important to note that before the price drop, the trend line is broken.
Attached Image (click to enlarge)
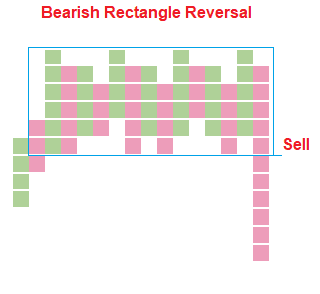
Bearish Rectangle Reversal
The uptrend forms a clear period of consolidation, the support line is then broken on a heavy volume day, it is at this point where the bearish signal occurs.
Great Thread Kourosh! What settings do you use for Point and Figure Charts? {image}
Ignored
Thank you for your interest in these advanced charting techniques! I'm pleased to see your enthusiasm for Renko and Point & Figure strategies - these are indeed powerful price action analysis methods. This is for TradingView setting. I've developed custom indicator for MetaTrader 4:
Hello Kourosh great work
i have one request for you, i want indicator to mark the column which has 15 or more Box , we call it "Anchor column" , the column which qualify for it should written "AC" above/below the column
Hello Kourosh great work i have one request for you, i want indicator to mark the column which has 15 or more Box , we call it "Anchor column" , the column which qualify for it should written "AC" above/below the column {image}
Ignored
I’d be happy to help you! Could you please provide more details? Also, would you like me to add it to my indicator?
{quote} I’d be happy to help you! Could you please provide more details? Also, would you like me to add it to my indicator?
Ignored
yes i want that in your indicator
Q. What is a anchor column?
A. A column which has minimum 15 box is called Anchor column
Anchor column represent strength in Trend , we can build some trading strategy around it
a very simple strategy is Anchor follow-through ( ARF )
Q. What is ARF and How can we trade it?
A. like its in name ARF is follow through of an anchor column, after we got our Anchor column we wait for retracement and then we trade on breakout of the anchor column , in simple term if anchor column is bullish then we buy at Double Top Buy and if anchor column is bearish then we sell at double Bottom Sell