With the Doctor's permission, here is my M1/M5 template, in case anyone wants to try it.{image} {file}
Ignored
The colors of the lines I show with the arrow are very pale. Isn't it difficult to follow and observe them? After all, the color change is important. And I think you replaced the star with an arrow to make it more noticeable, right?
{quote} The colors of the lines I show with the arrow are very pale. Isn't it difficult to follow and observe them? After all, the color change is important. And I think you replaced the star with an arrow to make it more noticeable, right? {image}
Ignored
Yes, you can change the colors to your liking, and the arrow is simply that I see it better.
{quote} You probably didn't download this version that the doctor posted, that's why you don't see it on your screen. {file}
Ignored
thanks for the answer guys. i manually input guppy history posted by jblanked and adjust the setting for 1m tf and 5m tf for scalping + guppy super trend
To Matteorossi :
Here is the setting you ask for, and I am not changing original setting from doctor.
Doctor also already mention the setting in previous post, post 502 and 531 .
Is better you ask question about indicator setting here, because I am not the creator of this system, I just use it blindly .
very good friends, first of all I want to thank you for sharing this system, and I want to ask a question, in this graph if we had entered the red vertical line, in the green candle should we exit? and re-enter in the next signal? thank you very much
very good friends, first of all I want to thank you for sharing this system, and I want to ask a question, in this graph if we had entered the red vertical line, in the green candle should we exit? and re-enter in the next signal? thank you very much
Ignored
If the candle is green and wicks also green then i usually close the trade irrespective of profit or loss. Or atleast shift SL to the high of the candle. in your pic the wick is grey. Any candle with grey wicks is a consolidation candle. Green candle green wick is a bullish candle. red candle with red wicks is bearish candle. This is how we interpreet APB candles.
To Matteorossi : Here is the setting you ask for, and I am not changing original setting from doctor. Doctor also already mention the setting in previous post, post 502 and 531 . Is better you ask question about indicator setting here, because I am not the creator of this system, I just use it blindly .
Ignored
There is a lot of discussion about the histogram. The logic of histogram is simple. For any timeframe our Gann activator is set to 9.
If on M1 the M5 histogram will be 9*5 = 45; M15 histogram will be 9*15 =135 and M30 histogram will be 9*30 =270 so on and so forth.
The advantage over using MTF histo there is no need to wait for the MTF candle to close for confirmation. Also M15 histo on M1 will give color of the last 15 candles (15 minutes) and not the actual candle like from 9.00 to 9.15.
Add as many histograms to a pirticular timeframe as you need.
I ususlly like to refer to 2 timeframes up for lower timeframes for lower timeframes as lower timeframes are used for scalping.
H4 and beyond the trend is already established for swing trades so entries may be taken without histo of D1.
still if needed add 9*4=36 histo on H4 fot D1 on H4
Hope you all understand.
For convinience I will post a new MTF templete adding histograms of two higher timeframes by tomorrow. I will need to modify the indicator to give proper alerts that can be understood easily.
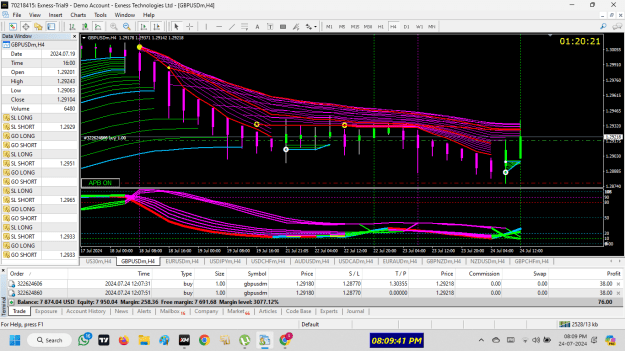
A trade i just entered. H4 with D1 and W1 hisograms.
As you see on H4 there is a failed breakdown. W1 is in uptrend. But D1 is in downtrend. When D1 color changes to lime the alert ahould be "on H4 D1 ternd change Buy". meaning the D1 histo on H4 timeframe has changed to uptrend.
This is what i prapose to do. {image} A trade i just entered. H4 with D1 and W1 hisograms. As you see on H4 there is a failed breakdown. W1 is in uptrend. But D1 is in downtrend. When D1 color changes to lime the alert ahould be "on H4 D1 ternd change Buy". meaning the D1 histo on H4 timeframe has changed to uptrend.
Ignored
Doc,
I may be wrong, but I don't see this pair revisit the extreme highs of 1.30000.
Price has moved up towards the lower/high to reverse downward on the 4H & 1H.
I stand to be corrected.
{quote} Doc, I may be wrong, but I don't see this pair revisit the extreme highs of 1.30000. Price has moved up towards the lower/high to reverse downward. I stand to be corrected.
Let us analyse my entry in this setup.
Though it does not follow the guidelines of all colours to be the same..... It resembles a failed breakdown.
Attached Image (click to enlarge)
1) my entry candle is Bullish APB. lime body and wicks.
2) It has broken 2 dynamic resistances TE 3 and TE 9.
3) All subwindow indicatores are lime.
4) RSIOMA in oversold zone turning lime.
These are High risk high reward trades. Need to monitor carefully. Book loss immediately if you feel that the setup is failing at the end of the H4 candle.
{quote} Doc, I may be wrong, but I don't see this pair revisit the extreme highs of 1.30000. Price has moved up towards the lower/high to reverse downward on the 4H & 1H. I stand to be corrected.
Ignored
A follow up at the end of H4 candle ( blue horizontal line)...
1) APB is still bullish candle.
2) This candle was not able to close beyond our guppy lines which act as dynamic resistance.
Attached Image (click to enlarge)
IF the next candle closes above the high of this candle.....
1) either there will be profit booking or
2) Stoplosses will be triggered.
The buyers were strong in last 8 hrs, not allowing to go the price down and pushing the price up.
Again IF the next candle closes above 1 and 2 .... the price will passively push up independent of strong buyers.
At this point even week buyers will push the price up without any effort. we are weak buyers but at that point all indicatrs will turn blue/lime and that will be entry candle as per guidelines. A sharp upmove with momentum can be expected.
To begin with just "Follow the color."
Study the charts and colors, understand, learn, ask questions, understand the logic, trade in demo account.
There is lots more to be a successful trader.
{quote} A follow up at the end of H4 candle ( blue horizontal line)...
Ignored
Why APB candles ?
Analyse the chart with japanese candles.
Attached Image (click to enlarge)
Candles marked are engulfing candles. As per them enter above the high and your SL is hit in the first 2 engulfing candles...... Note the 3rd (our entry candle) .
My question to all of you. what is diffrent in the 3rd candle as per our chart?
This is what i prapose to do. {image} A trade i just entered. H4 with D1 and W1 hisograms. As you see on H4 there is a failed breakdown. W1 is in uptrend. But D1 is in downtrend. When D1 color changes to lime the alert ahould be "on H4 D1 ternd change Buy". meaning the D1 histo on H4 timeframe has changed to uptrend.
Ignored
Hi. the histogram at the bottom does not appear in the one minute and 5 minute charts. how can we solve this problem? Can you please share a template to be used in the one minute and 5 minute charts. also the star symbol blends with the colors of the candles so many times that it is not visible that it is a star. it is not obvious.
This is what i prapose to do. {image} A trade i just entered. H4 with D1 and W1 hisograms. As you see on H4 there is a failed breakdown. W1 is in uptrend. But D1 is in downtrend. When D1 color changes to lime the alert ahould be "on H4 D1 ternd change Buy". meaning the D1 histo on H4 timeframe has changed to uptrend.