i will list out the information on screen, tell me what should my trade bias be ? price above m5 100 & 200 sma rsi above 50 on h1 & h4 price above 14 sma on h1 & h4 price on weekly pivot 740 stop loss automatically decided by a 14 candle high or low macd above zero line price above 20 sma on h1 & h4 anything left ? {image}
Ignored
left was the very basic price action concept
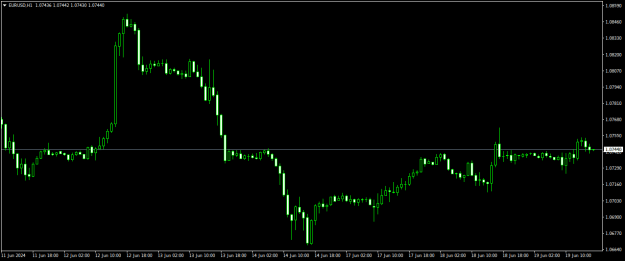
at 740 price is sitting on previous h1 support and current resistance level
do not follow me 99.9999999% of times, rest you can lol
{quote} and the important concept that i covered yesterday the 2 year bond yield chart with h1 US02Y bond yield chart showing a positive candle, that eurusd long position is at risk {image}
Ignored
basically it means that the US02Y bond yields chart is the summation of ALL USD economic news events.
and the easiest and the best usd trend indicator
Attached Image (click to enlarge)
do not follow me 99.9999999% of times, rest you can lol
if i use just 2 indicators on chart BB RSI the BB is a volatility indicator and the middle line is the 20 sma line on RSI we use just the 50 level [ qabove 50 bullish , below 50 bearish ] {image}
Ignored
basically price remains in a state of balance, when any economic news comes this balance is disturbed and we get a trade
locating this balance is the key
do not follow me 99.9999999% of times, rest you can lol
{quote} basically price remains in a state of balance, when any economic news comes this balance is disturbed and we get a trade locating this balance is the key
Ignored
on a blank chart, i could say that this red line was a balance
because many times price took support and many times it took resistance
do not depend on indicators, try to find why and where the balance will be disturbed next
Attached Image (click to enlarge)
do not follow me 99.9999999% of times, rest you can lol
{quote} basically price remains in a state of balance, when any economic news comes this balance is disturbed and we get a trade locating this balance is the key
{quote} on a blank chart, i could say that this red line was a balance because many times price took support and many times it took resistance do not depend on indicators, try to find why and where the balance will be disturbed next {image}
Ignored
You have the red line there because of these previous areas correct? Where previous price has settled (where orders/volume has accumulated previously)?
{quote} You have the red line there because of these previous areas correct? Where previous price has settled (where orders/volume has accumulated previously)? {image}
{quote} on a blank chart, i could say that this red line was a balance because many times price took support and many times it took resistance do not depend on indicators, try to find why and where the balance will be disturbed next {image}
Ignored
The perfect balance is: EUR/USD= 1.
The balance will be disturbed where the support is now.