Single Strategy Monte Carlo
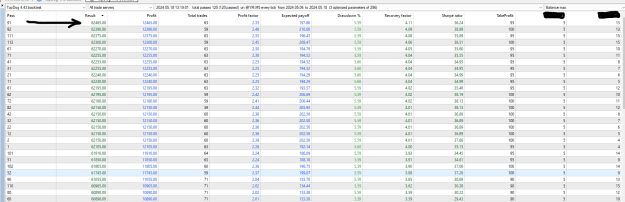
When testing a strategy, the absolute profit of a strategy does not say much. We can simply turn up the volume (aka "lot size") to generate more profit, but this obviously also increases the drawdown:
So looking at only the profit is not enough. We should also take the drawdown into account.
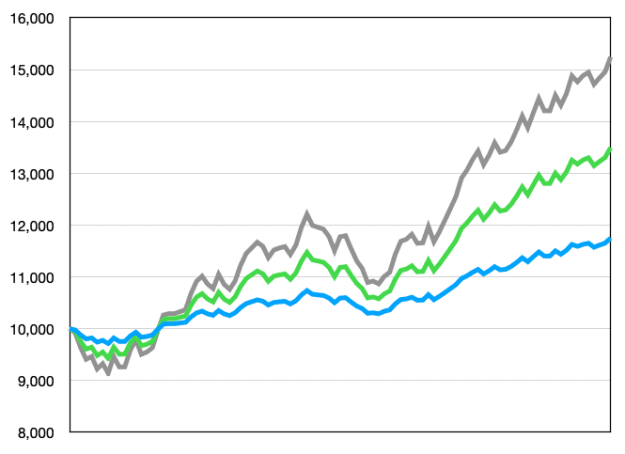
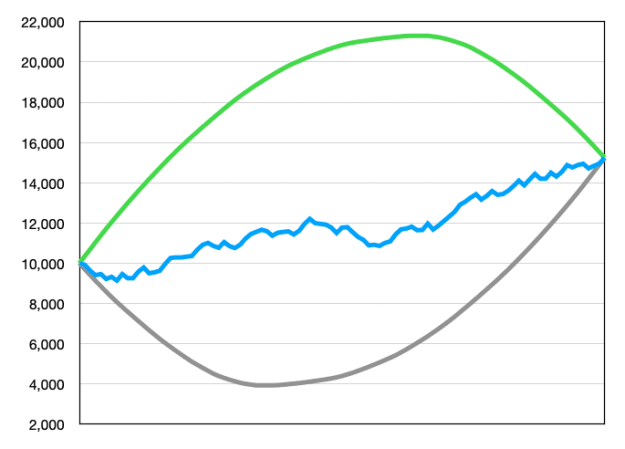
When testing a strategy you observe one particular order in which your trades made profits and losses. If the profits and losses are nicely mixed, your equity curve will follow a more or less straight line. However, even with an "edge", a large part of trading is still just probabilities. There is no guarantee that profits and losses will be consecutive. All the losses could be at the begin, or at the end. Below are three times the exact same trades but in a different order:
You would trade the blue line, but would you trade the gray or green lines?
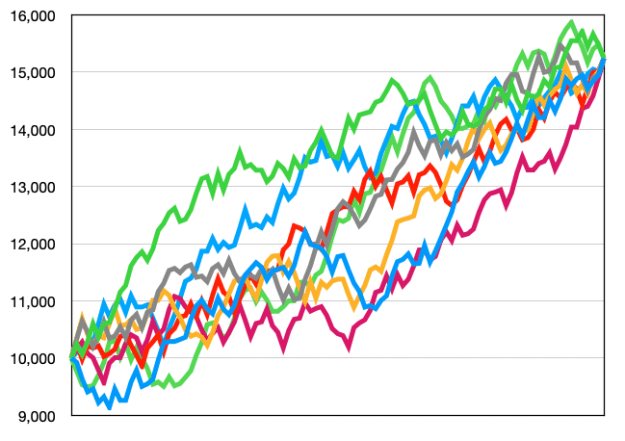
It is very unlikely that future trades will be in an weird order like that, but it is also unlikely that they will be like the blue line. This is where Monte Carlo simulation comes in. It simulates thousands of randomly shuffled trades and calculates the maximum drawdown of each of the corresponding equity curves:
We could look at the worst case scenario, but usually we ignore the top 5% extremely unlucky curves and focus on the 95%-percentile worst maximum drawdown. Based on this, we can now turn the volume knob, to tune the maximum drawdown to our risk appetite. Personally, I start to loose sleep once drawdown reaches 35% or more. After tuning the volume up or down to get desired maximum drawdown, we can calculate the corresponding profit.
This is a nice robust way to estimate the yearly return of various strategies to compare or optimize them.
Portfolio of Multiple Strategies
I have been using Monte Carlo like this for years when developing strategies. However, I am unsure how to apply this for a robot that executes hundreds of strategies in parallel. These strategies have slightly different settings for take profit target, stop losses, entry timings, etc. but all follow the same logic rules. This helps to diversify the response of the strategy to changing market conditions.
However, I feel that these strategies will occasionally suffer all at the same time when market conditions are not in favor because they implement the same logic rules. Therefore, it feels unrealistic to shuffle the total list of trades during the Monte Carlo simulation. I will have to take the "clustering" of profits and losses of the strategies into account somehow.
I have considered ignoring the individual trade results and simply chop up the equity curve of the backtest into 1-day sections and use the profit/loss of each day to shuffle. Would that be a better approach? For scalping strategies this would not take the intra day action into account, and for strategies that keep the positions open for days or weeks this would also be odd.
How should I approach this? Any recommendations?
When testing a strategy, the absolute profit of a strategy does not say much. We can simply turn up the volume (aka "lot size") to generate more profit, but this obviously also increases the drawdown:
Attached Image (click to enlarge)
So looking at only the profit is not enough. We should also take the drawdown into account.
When testing a strategy you observe one particular order in which your trades made profits and losses. If the profits and losses are nicely mixed, your equity curve will follow a more or less straight line. However, even with an "edge", a large part of trading is still just probabilities. There is no guarantee that profits and losses will be consecutive. All the losses could be at the begin, or at the end. Below are three times the exact same trades but in a different order:
Attached Image (click to enlarge)
You would trade the blue line, but would you trade the gray or green lines?
It is very unlikely that future trades will be in an weird order like that, but it is also unlikely that they will be like the blue line. This is where Monte Carlo simulation comes in. It simulates thousands of randomly shuffled trades and calculates the maximum drawdown of each of the corresponding equity curves:
Attached Image (click to enlarge)
We could look at the worst case scenario, but usually we ignore the top 5% extremely unlucky curves and focus on the 95%-percentile worst maximum drawdown. Based on this, we can now turn the volume knob, to tune the maximum drawdown to our risk appetite. Personally, I start to loose sleep once drawdown reaches 35% or more. After tuning the volume up or down to get desired maximum drawdown, we can calculate the corresponding profit.
This is a nice robust way to estimate the yearly return of various strategies to compare or optimize them.
Portfolio of Multiple Strategies
I have been using Monte Carlo like this for years when developing strategies. However, I am unsure how to apply this for a robot that executes hundreds of strategies in parallel. These strategies have slightly different settings for take profit target, stop losses, entry timings, etc. but all follow the same logic rules. This helps to diversify the response of the strategy to changing market conditions.
However, I feel that these strategies will occasionally suffer all at the same time when market conditions are not in favor because they implement the same logic rules. Therefore, it feels unrealistic to shuffle the total list of trades during the Monte Carlo simulation. I will have to take the "clustering" of profits and losses of the strategies into account somehow.
I have considered ignoring the individual trade results and simply chop up the equity curve of the backtest into 1-day sections and use the profit/loss of each day to shuffle. Would that be a better approach? For scalping strategies this would not take the intra day action into account, and for strategies that keep the positions open for days or weeks this would also be odd.
How should I approach this? Any recommendations?