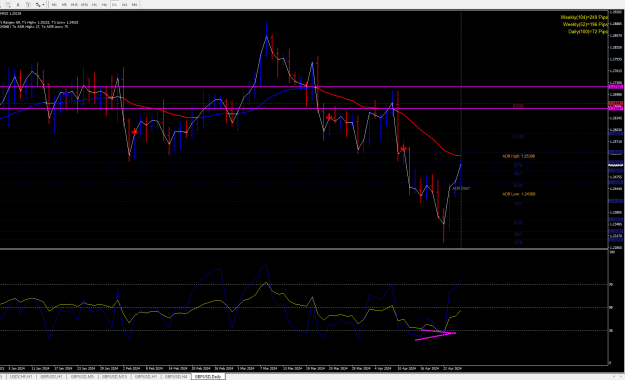
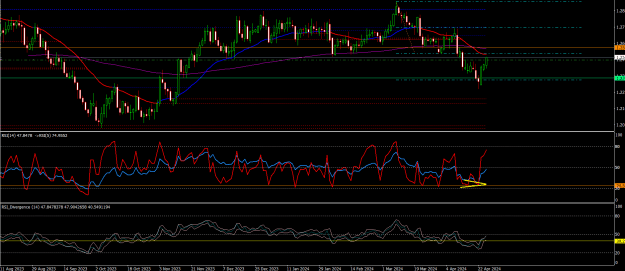
Another bad day, another loss. Here is how i trade yesteday
Attached Image (click to enlarge)
I'm busy yesterday so i miss our trade time, price is too near EMA H1
So my first order is at 1, i buy due to M5 DIV bull and got stoploss
I re-entry at 2, my target is 2454, the first EMA swing level on M5 (orange line), but i got BE +1 at X
After that, i feel i can't focus anymore, so i quit and call it a day
Look back, the fact i don't sell hedge at H1 50% AB=CD show i'm already lost focus. This is hard
[quote=eliotjng;14843738]Another bad day, another loss. Here is how i trade yesteday {image} I'm busy yesterday so i miss our trade time, price is too near EMA H1 So my first order is at 1, i buy due to M5 DIV bull and got stoploss I re-entry at 2, my target is 2454, the first EMA swing level on M5 (orange line), but i got BE +1 at X After that, i feel i can't focus anymore, so i quit and call it a day Look back, the fact i don't sell hedge at H1 50% AB=CD show i'm already lost focus. This is hard[/quote]
Don't worry it will become second nature just like driving a car.
It might pay you to have a handy little list of things to watch for on a hard copy you can refer to.
I have added a couple of things here to your chart to consider...
Well overnight I see the4-hour has found support and is still on track to the target level... {image} I only made a total of 23 pips yesterday. It was so slow. After a slow market day, I am always wary that a bigger move is in the making.
Ignored
I think Alan is right as always. This spring is winding up slowly ready to blow. H4 is showing signs of divergence for a drop. H1 is OB, possible crash back to daily open.
Another bad day, another loss. Here is how i trade yesteday {image} I'm busy yesterday so i miss our trade time, price is too near EMA H1 So my first order is at 1, i buy due to M5 DIV bull and got stoploss I re-entry at 2, my target is 2454, the first EMA swing level on M5 (orange line), but i got BE +1 at X After that, i feel i can't focus anymore, so i quit and call it a day Look back, the fact i don't sell hedge at H1 50% AB=CD show i'm already lost focus. This is hard Don't worry it will become second nature just like driving a car. It might...
Ignored
Thank you for advice Alan, I will try your ideas tomorrow then.
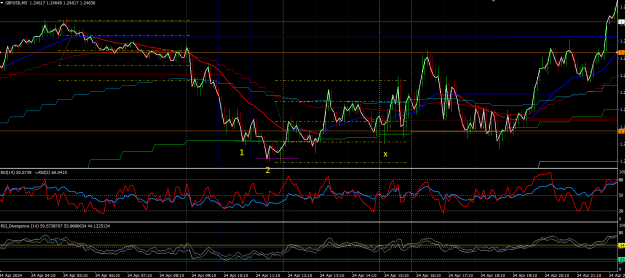
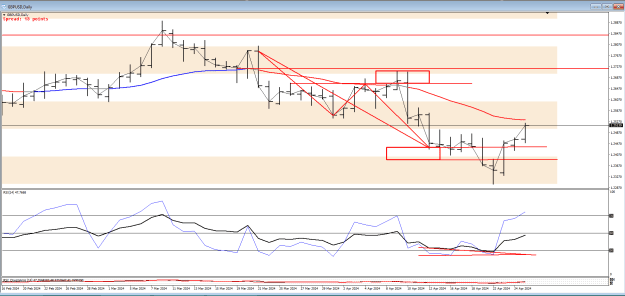
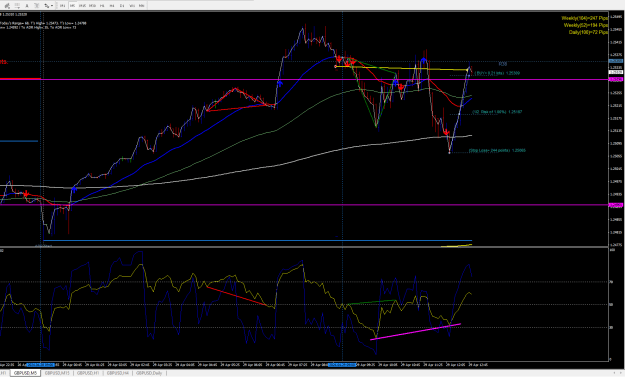
My opinion, from daily chart already finish AB=CD and form DIV bull, maybe price today will come back at least daily EMA before go back ?
{quote} Thank you for advice Alan, I will try your ideas tomorrow then. My opinion, from daily chart already finish AB=CD and form DIV bull, maybe price today will come back at least daily EMA before go back ? {image}
Ignored
Not sure about the going back on the bounce. To me that is in the lap of the gods.
Here is the daily AB=CD for those who don't understand...
Attached Image (click to enlarge)
Note the only div that counted was after the target was hit.
Perfect. Price not reach daily EMA as i guess, but when i saw H1 HD bear + M1 EMA make LH/LL, i short.
Wonderful, and result is ...?
I'm forget today have strong news, it just hit my stoplosss.
Tell me, how can you make same mistake twice? You yourself know that you need to observe price BEFORE strong news, and make decision of whether hedge, close or move stop, right?
Well, i'm lacking of a tool call " Alan handy little list of things", you are not provide that for me yet.
I will provide that to you tomorrow, promise me you better not repeat that mistake again
{quote} I think Alan is right as always. This spring is winding up slowly ready to blow. H4 is showing signs of divergence for a drop. H1 is OB, possible crash back to daily open.
Ignored
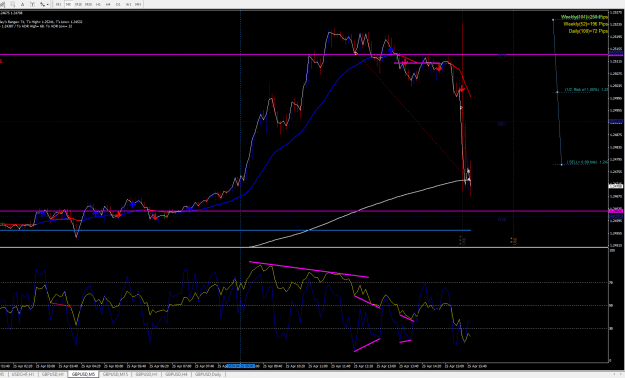
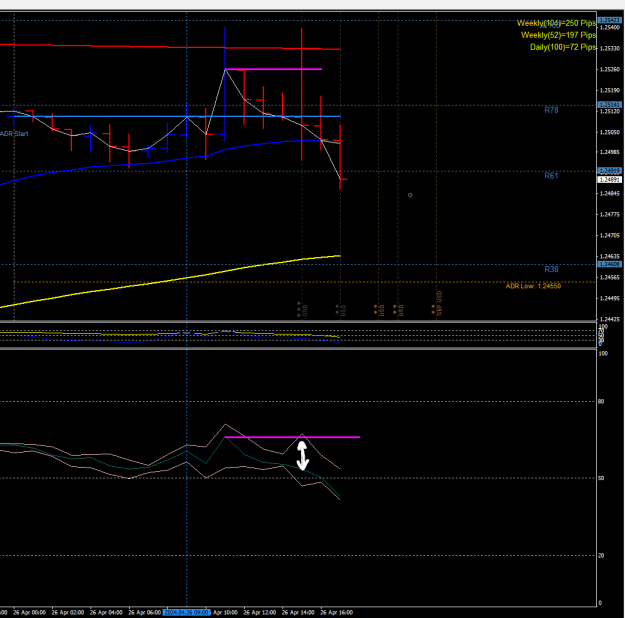
And there it was. crashed back to daily open as predicted. Getting good at this
{quote} Couple of things to point out here for your edification (nice word). And yes, you are getting good at this. {image}
Ignored
Cheers Al,
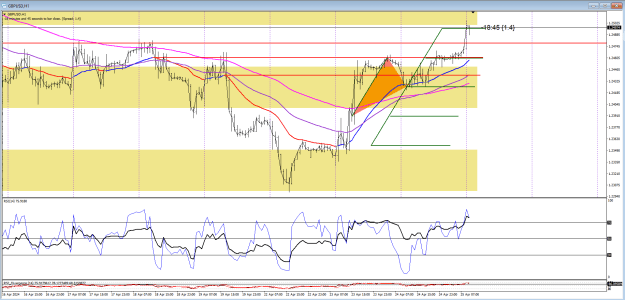
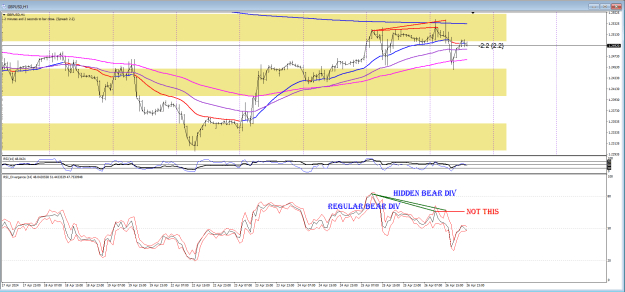
I keep looking at this RSI hidden indi of yours and find it totally baffling. The middle line in the RSI channel is just RSI(14) by the looks of it.
So what part of the hidden RSI are we drawing the horizontal line from?
I understand the hidden divergence concept like when we get a pinbar but this indi is driving me insane.
If we draw a line from the middle RSI line outwards then the upper RSI channel does cross that line and there is a gap to the normal RSI(14) which would suggest hidden divergence. Am I right?
{quote} Cheers Al, I keep looking at this RSI hidden indi of yours and find it totally baffling. The middle line in the RSI channel is just RSI(14) by the looks of it. So what part of the hidden RSI are we drawing the horizontal line from? I understand the hidden divergence concept like when we get a pinbar but this indi is driving me insane. If we draw a line from the middle RSI line outwards then the upper RSI channel does cross that line and there is a gap to the normal RSI(14) which would suggest hidden divergence. Am I right? {image}
Ignored
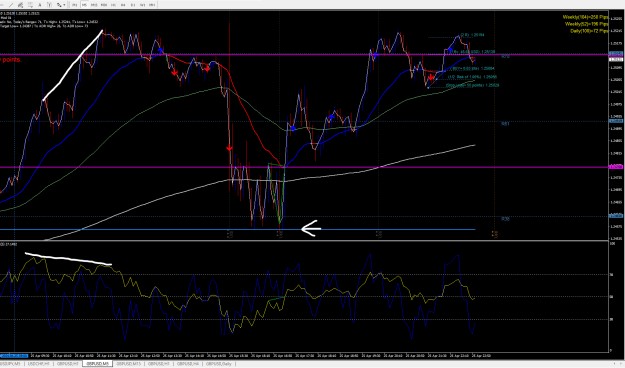
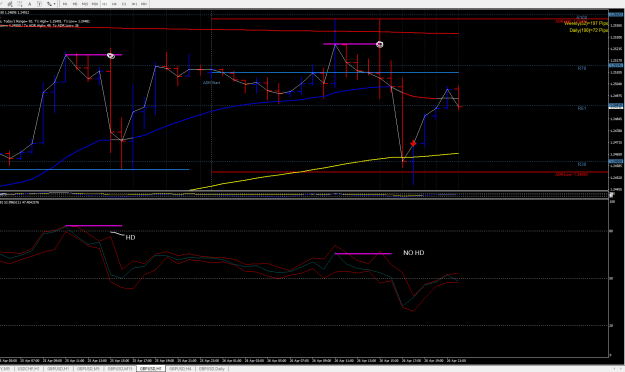
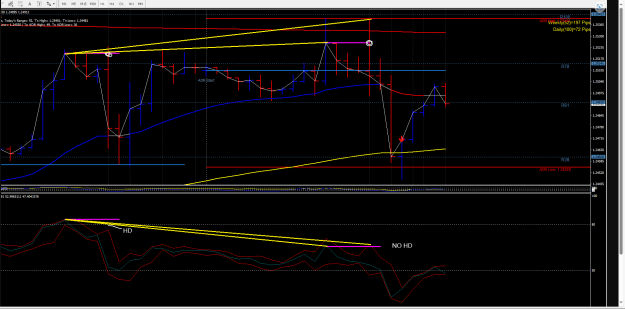
On further inspection I think I now understand the hidden divergence indi.
First one is HD and the second is not HD. Quite why that is I have idea because they both look the same.
Also looks like a big part of the move has been lost as well if we wait for the HD signal to show up.
{quote} On further inspection I think I now understand the hidden divergence indi. First one is HD and the second is not HD. Quite why that is I have idea because they both look the same. Also looks like a big part of the move has been lost as well if we wait for the HD signal to show up. {image}
Ignored
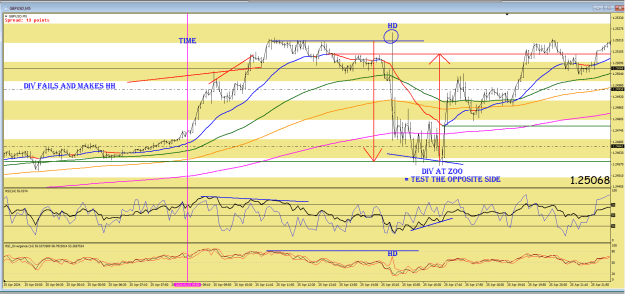
Kerrect (not)
The first one was HD., you had no problem with that.
The second one was in regular bear div but it failed (expect a HH).
Look what happened with that expected HH. It ran into a bear HD.
Attached Image (click to enlarge)
Let me explain this a little....
This RSI is just a regular RSI of 14 periods, nothing unusual about that. However, as price moves the RSI repaints correspondingly with the price movements. This particular RSI also paints the highest and lowest levels the RSI reached giving us a history of the RSI movements fixing the highest and lowest levels moved to.
The value of this is we have a permanent record of the movements both of price and the RSI. Price has the wicks the RSI has this history. So I can look back and say I see the HD. I couldn't do this normally because it is HIDDEN.
We should chat about this more if it is not understood because it is very important.
Todays trade taken out at BE. H1 and M15 showing divergence. Maybe my 40 pip target should have been the H1 EMA instead as that is where some more divergence popped up. Never mind