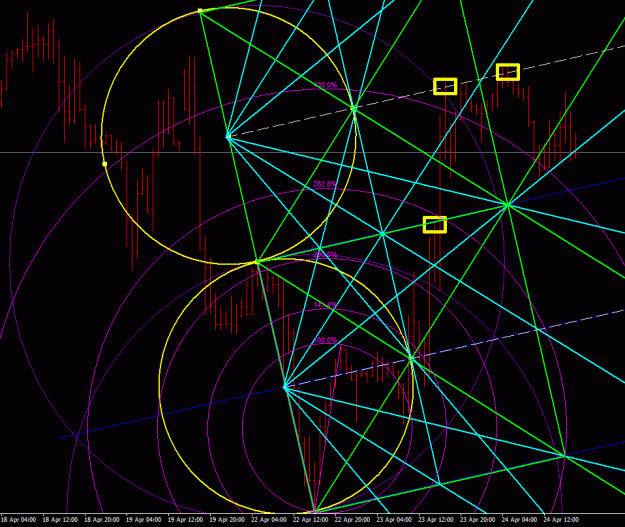
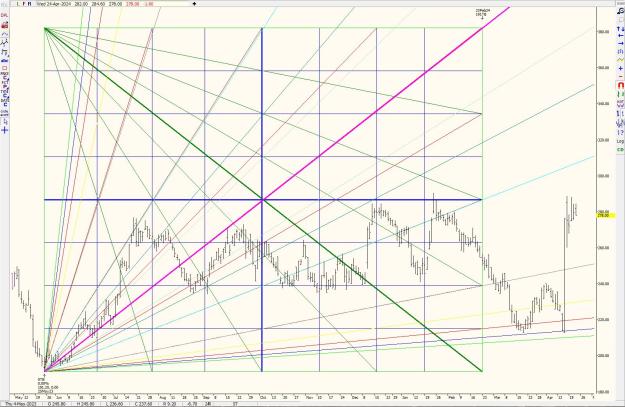
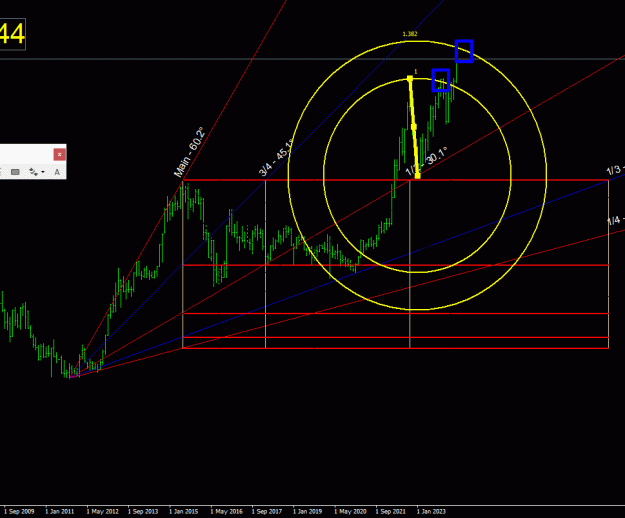
this graph is more complex but as you can see it is the same graph placed yesterday ... the structure of the square has stopped the rise in the yellow rectangles
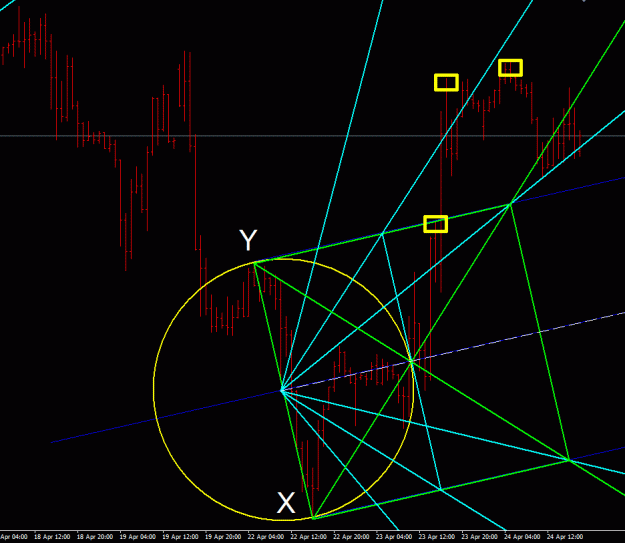
now I have removed all the lines that create confusion for those who do not know them... I have also removed the circles with which I built the VESICA PISCIS and consequently the construction of the PITCHFORK... I only left the green square built on the YX collapse . I will never thank jeanlouie enough who built all the free geometric indicators
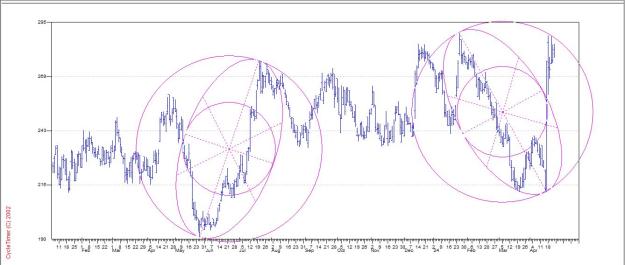
The S is an ellipse - hard to find then all the time, but occasionally they show up
We are forced to look at price action on a 2 dimensional screen - price action is moving in 4 dimensions, hence all the distortions and missed timing etc - price twists as it crosses our view on the 2 D screen - this is why some double/triple tops/bottoms slightly under or overrun - If we could see then on a 3D screen we'd find more exactness
this charting software isn't great as it doesn't scale properly, but its near enough for quick analysis etc
The first price action upwards created the ellipse - which unfolds into a circle as shown, the 2nd ellipse down is the same sized ellipse as the first up one - this is Jenkins "Measured Move"
Again with all of this, its KNOWING what, where and when which is super super hard
you are a fox....ahaha...it's true, you're right...the S is the ellipse....only that I still have to understand well how to draw it BEFORE the swings develop. As regards the inclination in bearish swings I found: 300°,315°,330°...but it is absolutely not certain that the opposite swing up has the same opposite degrees.
question: how do I find the two foci of the ellipse to be able to draw it???
I have to ask jeanlouie to build the indicator to draw the ellipse with the degrees of the inclination
Another little update on playing with secret angle timing projections - this is 5min NQ again today from the initial upmove. It picked out some smaller swings aswell as the 0830 news candle quite cleanly. Also added a couple of separate confluent arcs for some of the times. The horizontal levels are not from the secret angle but are my own snr levels as I mentioned before.
you are a fox....ahaha...it's true, you're right...the S is the ellipse....only that I still have to understand well how to draw it BEFORE the swings develop. As regards the inclination in bearish swings I found: 300°,315°,330°...but it is absolutely not certain that the opposite swing up has the same opposite degrees. question: how do I find the two foci of the ellipse to be able to draw it??? I have to ask jeanlouie to build the indicator to draw the ellipse with the degrees of the inclination
Ignored
I have no idea on building the Ellipse's - I'm far from an Engineer - although my 2 sons would know
I've drawn the same Ellipse on Cowans software the same as above and note there's differences - I would trust Cowans software here more than the other one above
just today the PC with the old but faithful WXP on which Ganntrader and Cycle Timer ran broke, I hope to have it back soon
Ignored
Fingers crossed
I've never got on that well with Ellipses for trading
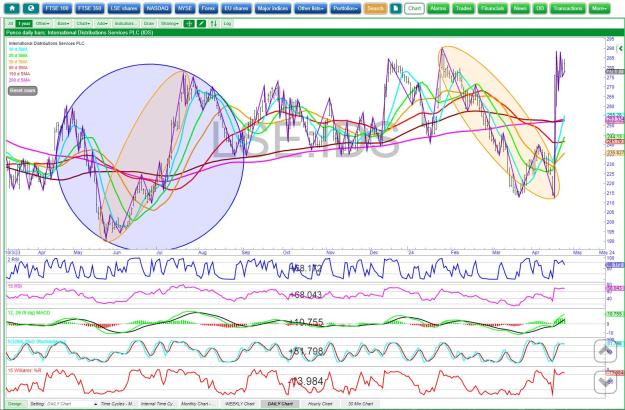
The chart below is the same market as above LSE:IDS - I just used DT software to analyse the timing
What I did was took the LOW 191.2, doubled it and ran TIMING out by the same amount of trading days 191 (can't do decimals)
This created a 1 x 1 square
As you can see price didn't work to the 1 x 1, it moved 50% (ish) and thereby worked out half the price to the full TIME which is 50% - the % splits of the box were also pretty good for timing swings
So "IF" price was working to the harmonics of the box, its fair to say that Gann Angles matching the box should play a part at some point in the journey of the market and as you can see they did (you just run a 1 x 1 Gann angle along the diagonal of the box and the other angles are auto generated)
The ellipses above were the same length, but you could easily have just drawn vertical lines to get a "measured move" and when you see one landing right on a Gann angle, you need to be alert - think this one was the 1 x 10 angle
now I have removed all the lines that create confusion for those who do not know them... I have also removed the circles with which I built the VESICA PISCIS and consequently the construction of the PITCHFORK... I only left the green square built on the YX collapse . I will never thank jeanlouie enough who built all the free geometric indicators {image}
sorry but you will also understand that, after having spent years finding 1) how to put the MT4 or MT5 in scale 2) the right scale for the instruments I follow (currencies and SP500).... I don't feel like writing this on a forum....if we want to discuss geometry....analysis...etc..etc...ok...there are no problems but please don't ask me how I did it. I have already been asked other times and I have already given suggestions other times... if you search you will find my answers on 3D TIME AND PRICE FORECASTING. I hope you will understand....
{quote} Fingers crossed I've never got on that well with Ellipses for trading The chart below is the same market as above LSE:IDS - I just used DT software to analyse the timing What I did was took the LOW 191.2, doubled it and ran TIMING out by the same amount of trading days 191 (can't do decimals) This created a 1 x 1 square As you can see price didn't work to the 1 x 1, it moved 50% (ish) and thereby worked out half the price to the full TIME which is 50% - the % splits of the box were also pretty good for timing swings So "IF" price was working...
Ignored
Hello THTPRO,
I also did similar experiments by building the square starting from the single price: I converted it into the number of bars and used the latter as a radius to build the square and consequently the GANN BOX. One thing above all: it takes time to build everything by hand... sometimes it's worth it!
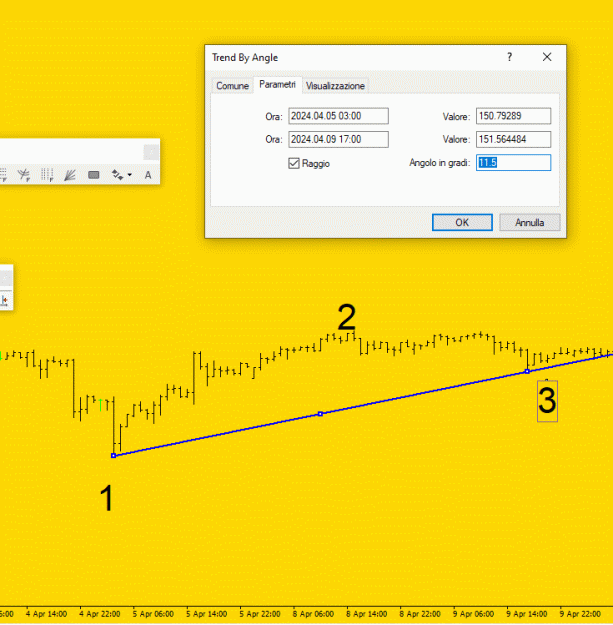
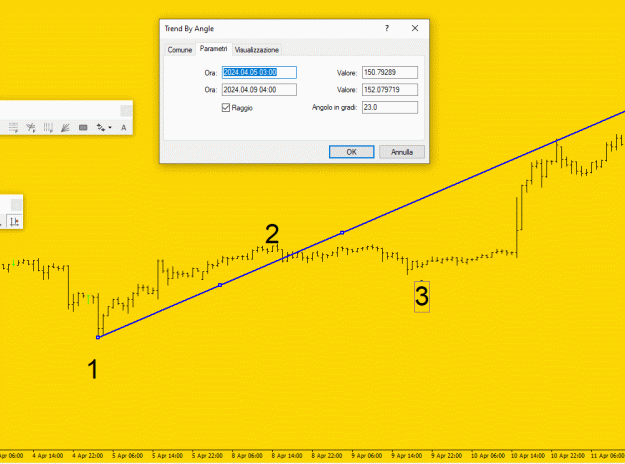
I want to share a small/big discovery with everyone:
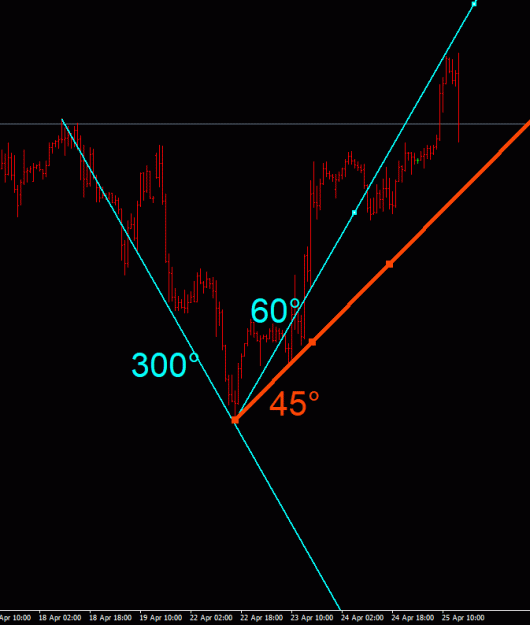
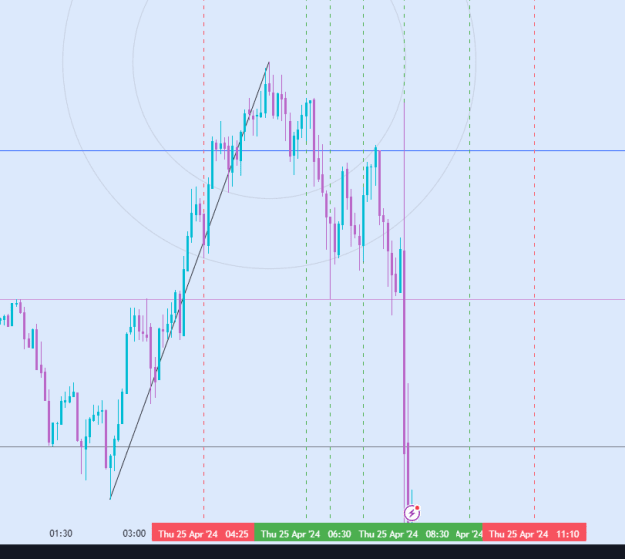
1) consider 123 by JOE ROSS (previously impulsive wave 1 and retracement wave 2)
2) calculate the angle that exists between low (point 1 of ROSS 123) and point 3
3) this angle must be multiplied by 2 or 3 to find the trendline where the next top will form. In practice it is the exact opposite of how Jenkins obtains his angles: he looks at the LOW_TOP angle ... for example 36°, after which he executes 36/2...36/3...36/4 .... 36x3/4...36x2/3. Instead I look at the LOW_LOW angle and get the other angles so I have a prediction! I hope I have explained myself
here I put a portion of the graph taken at random....but as you can see it works...I multiplied the angle of 11.5° x 2
I want to share a small/big discovery with everyone: 1) consider 123 by JOE ROSS (previously impulsive wave 1 and retracement wave 2) 2) calculate the angle that exists between low (point 1 of ROSS 123) and point 3 3) this angle must be multiplied by 2 or 3 to find the trendline where the next top will form. In practice it is the exact opposite of how Jenkins obtains his angles: he looks at the LOW_TOP angle ... for example 36°, after which he executes 36/2...36/3...36/4 .... 36x3/4...36x2/3. Instead I look at the LOW_LOW angle and get the other...
Ignored
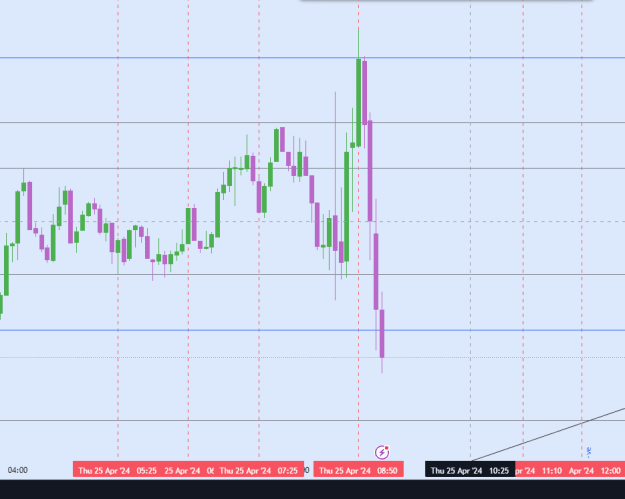
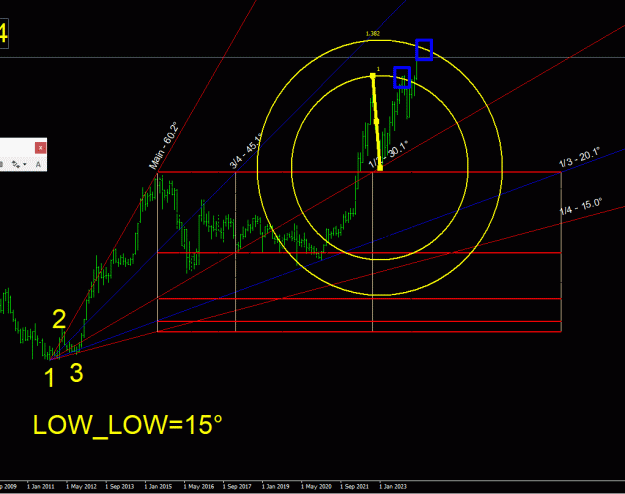
how stupid I am.... you can also see the example in the monthly chart of the USDJPY... in fact if you zoom in you will see that the LOW_LOW angle is 15°.... in this case the top is made on the 'angle of 15x4=60°